How do I show the Target line in the trend in Scorecard LIST View
- Mark as New
- Bookmark
- Subscribe
- Mute
- Subscribe to RSS Feed
- Permalink
- Report Inappropriate Content
02-26-2018 04:01 AM
Hi All,
How do we show the target line on the Trend in the Scorecard list view. the target is already set on the detailed scorecard
Example:

As shown above the target line getting displayed in the list view of the scorecard. This indicator and its base indicators are set for Daily Frequency. Can we show the target line in the Monthly Frequency indicators?
Regards,
Vasanth
- Labels:
-
Performance Analytics
- Mark as New
- Bookmark
- Subscribe
- Mute
- Subscribe to RSS Feed
- Permalink
- Report Inappropriate Content
02-26-2018 01:43 PM
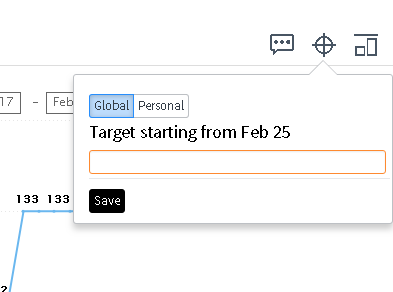
I'm going to attempt to answer this - there is another way to set a trend line. If you drill into the widget to the 'chart' view, click on your chart where you want the target value to start then click on the circle with the cross in it (upper right corner), enter your target value and save. Hope this helps.

- Mark as New
- Bookmark
- Subscribe
- Mute
- Subscribe to RSS Feed
- Permalink
- Report Inappropriate Content
02-26-2018 07:52 PM
Hi Vasanth,
If you want the target to be displayed for Monthly frequency of the same indicator, first you need to define target for Monthly aggregate. Use timeseries functions here and define the metric at BY Month SUM or BY Month AVG depending upon usecase and set the target value. Now try to apply the same time series whatever you applied in Targets at the Indicator level and then the target would be visible for you in Trend line for Monthly aggregates.
For more info on time series aggregates, please refer below link
https://docs.servicenow.com/bundle/kingston-performance-analytics-and-reporting/page/use/performance-analytics/reference/time-series-in-scorecards-widgets.html
Thanks,
Padmanabam Tirumala