- Mark as New
- Bookmark
- Subscribe
- Mute
- Subscribe to RSS Feed
- Permalink
- Report Inappropriate Content
01-26-2016 11:16 AM
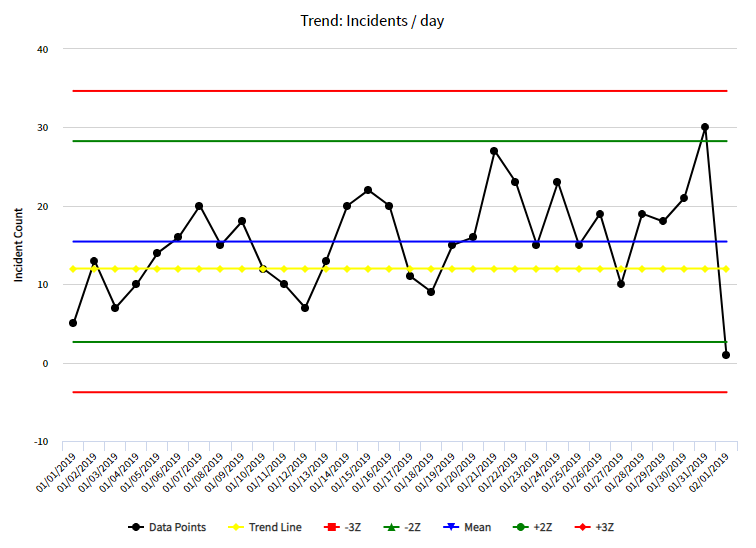
Made a Control chart from the incident table. Since there will never be a negative number of incidents, is there a way to change the y-axis to start at zero as the lower bound?

Solved! Go to Solution.
- Labels:
-
Performance Analytics
- Mark as New
- Bookmark
- Subscribe
- Mute
- Subscribe to RSS Feed
- Permalink
- Report Inappropriate Content
03-23-2016 12:00 PM
Click the gear icon to the right of the Type field, select Axis, then Y, then edit From and To fields.
- Mark as New
- Bookmark
- Subscribe
- Mute
- Subscribe to RSS Feed
- Permalink
- Report Inappropriate Content
03-23-2016 12:00 PM
Click the gear icon to the right of the Type field, select Axis, then Y, then edit From and To fields.
- Mark as New
- Bookmark
- Subscribe
- Mute
- Subscribe to RSS Feed
- Permalink
- Report Inappropriate Content
02-01-2019 08:45 AM

- Mark as New
- Bookmark
- Subscribe
- Mute
- Subscribe to RSS Feed
- Permalink
- Report Inappropriate Content
08-12-2019 07:56 AM
Same here and sadly we never get less than 0 incidents created per day so showing -3Z and -2Z is really not useful in a report on created incidents