How to create a Monthly Backlog report
- Mark as New
- Bookmark
- Subscribe
- Mute
- Subscribe to RSS Feed
- Permalink
- Report Inappropriate Content
10-12-2017 12:38 PM
Hello
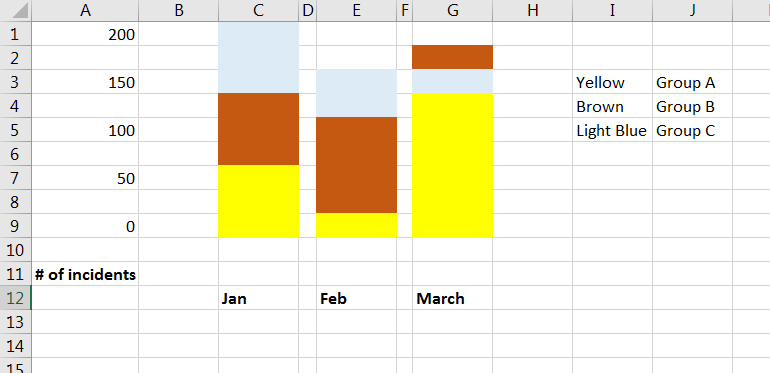
We need a monthly trending backlog report that shows incidents that are open for that point in time when the report is executed. If a ticket is open in Jan and Feb, then it would show for both months that it is open. See screenshot below.
I thought I would achieve this with the incident_metric table but there are a few issues. You can't aggregate by default on Incident Number so if you pull in New and In progress tickets, it will double count. We can't use the Active is true either as Resolved tickets are active for 7 days after, so I believe that is a bit misleading. I think this is the table that can help
Sample result:

What I've tried so far.
One of the issues is that you can't count distinct, so you will get the ticket in the output twice which isn't good. And depending on how they log the ticket, through the front end or back end portal they sometimes go right to In progress.


Can someone suggest or chat about how they were able to get a monthly backlog report of open tickets?
Thanks
- Labels:
-
Dashboard
-
Performance Analytics
-
Reporting
- 14,587 Views
- Mark as New
- Bookmark
- Subscribe
- Mute
- Subscribe to RSS Feed
- Permalink
- Report Inappropriate Content
10-13-2017 04:03 PM
as per my knowledge, It is not possible using simple report on incident or incident_metric table.
You have to use custom report or Performance Analytics.
- Mark as New
- Bookmark
- Subscribe
- Mute
- Subscribe to RSS Feed
- Permalink
- Report Inappropriate Content
10-13-2017 06:05 PM
I'm thinking the same thing. I'm looking at PA. The # of open incidents indicator. Just trying to see how I can roll this up to the month level.
- Mark as New
- Bookmark
- Subscribe
- Mute
- Subscribe to RSS Feed
- Permalink
- Report Inappropriate Content
10-17-2017 06:26 AM
I'm not sure using ServiceNow's out-of-box reporting engine you'll be able to remove the duplicates on the incident_metric table -- even if you had "Count Distinct", like Explore Analytics has, it wouldn't help if the same incident changed groups in Jan and Feb, for example.
This video shows you how Explore Analytics could do it:
Backlog Reporting for ServiceNow - YouTube
You could get a single license if all you need is this backlog.
- Mark as New
- Bookmark
- Subscribe
- Mute
- Subscribe to RSS Feed
- Permalink
- Report Inappropriate Content
10-12-2017 11:21 PM

- Mark as New
- Bookmark
- Subscribe
- Mute
- Subscribe to RSS Feed
- Permalink
- Report Inappropriate Content
10-13-2017 06:20 AM
Is that intentional --> 2 "Created on this month" ?