How to create/display a Comparison Report of Fiscal Year 19 and Fiscal Year 20?
- Mark as New
- Bookmark
- Subscribe
- Mute
- Subscribe to RSS Feed
- Permalink
- Report Inappropriate Content
04-27-2020 08:08 AM
Creating a Comparison Report of Fiscal Year 19 and Fiscal Year 20
I want to create a report or series of reports comparing 2 years worth of data, how would I go about doing that?
At the moment I have created 2 widgets to try and represent the data, in the Incident Comparison widget I am using the Indicator number of open Incidents with a widget indicator with data collected over the past 2 years. In the FY 19 series widget, I am using the indicator source with the 2 years of data with the Previous Period chart selected displaying a period over the past 2 years.
Both widgets display the data somewhat but they don't not layer/display clearly on top of each other like a report with 2 line graphs would by the months.


Basically, I am trying to present the data of the 2 years comparing the number of incidents month by month on one report
Thanks, Garrett
- Labels:
-
Dashboard
-
Performance Analytics
-
Reporting
- Mark as New
- Bookmark
- Subscribe
- Mute
- Subscribe to RSS Feed
- Permalink
- Report Inappropriate Content
04-27-2020 08:20 AM
Hi,
When you are creating a widget for first indicator their is option in related list as widget indicator,
have you used that?
as a best practice select a visualization that works well with the visualization of the primary indicator. For instance, show the primary indicator as columns and the secondary indicators as lines. If you are using a Stacked Column visualization for the primary indicator of a time series widget, set all secondary indicators to also use Stacked Column.
if you are using both as line then make sure that you are using the same widget type with same visualization type.

- Mark as New
- Bookmark
- Subscribe
- Mute
- Subscribe to RSS Feed
- Permalink
- Report Inappropriate Content
04-27-2020 09:51 AM
Yes in the first widget "Incident Comparison" I am using the indicator "Number of open incidents" with the widget indicator called Incidents - FY 19, which is an idicator source of incidents opened between September 1 2018 and August 31st 2020 which results the display of the first widget showing the count by month but not displayed clearly.


- Mark as New
- Bookmark
- Subscribe
- Mute
- Subscribe to RSS Feed
- Permalink
- Report Inappropriate Content
04-27-2020 08:53 AM

- Mark as New
- Bookmark
- Subscribe
- Mute
- Subscribe to RSS Feed
- Permalink
- Report Inappropriate Content
04-27-2020 09:58 AM
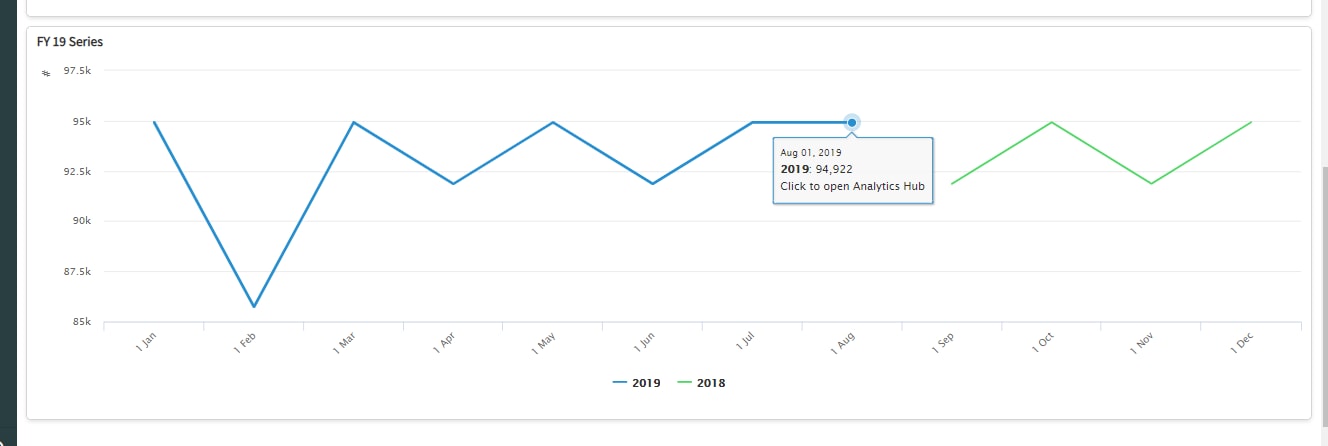
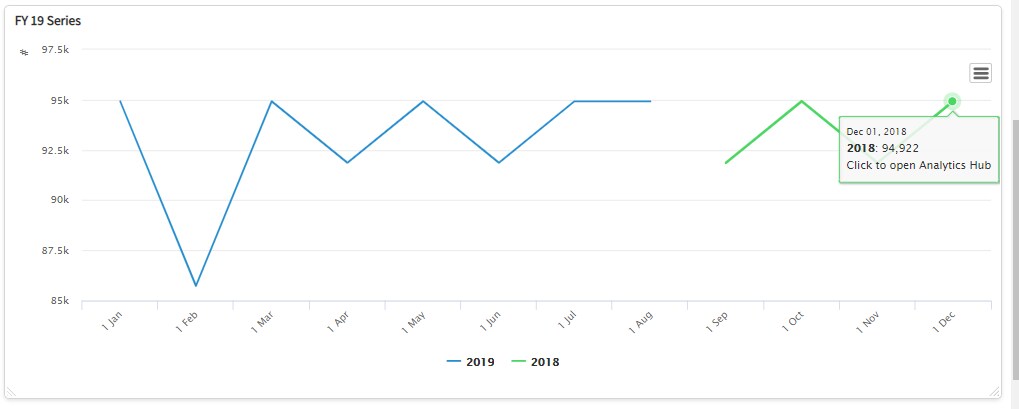
Yes in the FY 19 Series widget I have selected Previous Period Chart and selected the range of periods to 2 years, what it displays the 2 lines by the years but not the amount of the values side by side, more like a continuation from 2018 to 2020.


