- Mark as New
- Bookmark
- Subscribe
- Mute
- Subscribe to RSS Feed
- Permalink
- Report Inappropriate Content
03-16-2021 08:13 AM
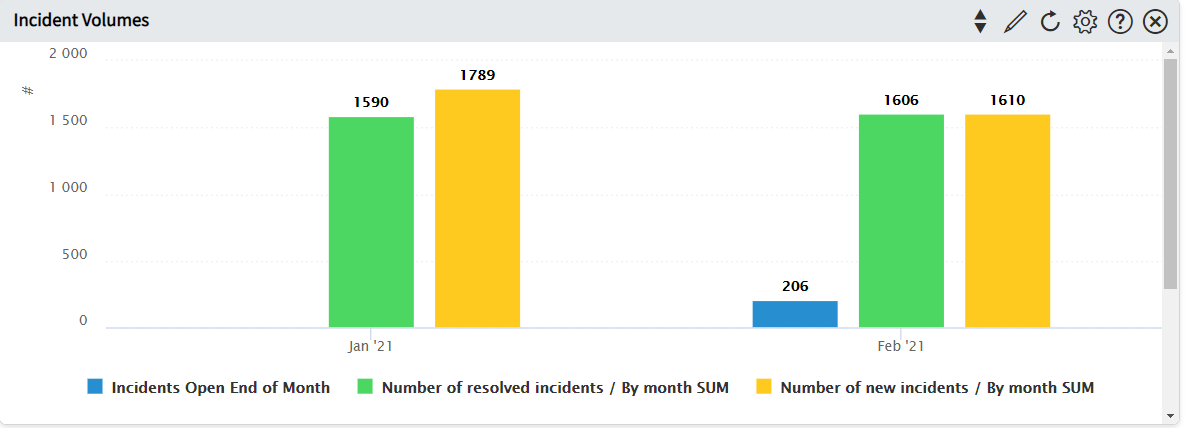
In would like to get on 1 report
-the number of incident tickets created per month (column)
-the number of incident tickets closed per month (column)
- the number of open tickets (backlog) at the last day of each month (line)
See enclosed what I expect it would look like
The first two line are easy to get on a simple report using multiple datasets, but how to add the third one (may require PA) ?
Solved! Go to Solution.
- Labels:
-
Dashboard
-
Performance Analytics
- Mark as New
- Bookmark
- Subscribe
- Mute
- Subscribe to RSS Feed
- Permalink
- Report Inappropriate Content
03-17-2021 10:19 AM
Hi!
Make sure your indicator source is set up for monthly frequencies:

With that set up, even if you historic jobs is set with a "days ago" intervals (for example a start date of 180 days ago) you will still only get one score per month. If the indicator source is set to daily, so will the automated indicator, and you will get a daily score of all the incidents open that month.
- Mark as New
- Bookmark
- Subscribe
- Mute
- Subscribe to RSS Feed
- Permalink
- Report Inappropriate Content
03-16-2021 08:45 AM
You probably have to get this report to run once a mth say on the first hour of a new month and it would look back at resolved last mth, created last month, then take a current snapshot of what is in the backlog
You can do this in 1 report by researching and implementing Multidataset report.
You make the first of the three, then you go to select Multidataset report, make the 2nd, then the 3rd
https://docs.servicenow.com/bundle/paris-now-intelligence/page/use/reporting/concept/c_MultipleDataSets.html
- Mark as New
- Bookmark
- Subscribe
- Mute
- Subscribe to RSS Feed
- Permalink
- Report Inappropriate Content
03-16-2021 09:59 AM
Hi Patrick,
Your suspicions are absolutely correct - requires PA.
The first two KPIs are simple as you're using a date field: Created on and Closed on, for Opened and Closed Incidents, respectively. Things become more challenging when analysing a volatile field - such as the State - as this will continuously change through a tickets lifecycle.
Within PA, you would create an Indicator which essentially took a snapshot each month of the amount of Incidents which weren't closed, be it: Open, In Progress, etc. SNOW then saves this value within a Scorecard which you can plot over a timeseries. You could do the same for Created and Closed.
The only other way is manual, and where you'd schedule a report on 1st of the month (at 00:01) detailing all Open Incidents at that point in time. You'd then need to bring that data into Excel or whatever, and use that to plot it against similarly scheduled reports for Created and Closed.
Clearly, using PA is the simpler and more elegant approach but it isn't always an option for some companies.
I hope that helps?
Thanks,
DJL
- Mark as New
- Bookmark
- Subscribe
- Mute
- Subscribe to RSS Feed
- Permalink
- Report Inappropriate Content
03-16-2021 10:20 AM
Yes, to get a snapshot of the situation at the end of the month, you need to use PA.
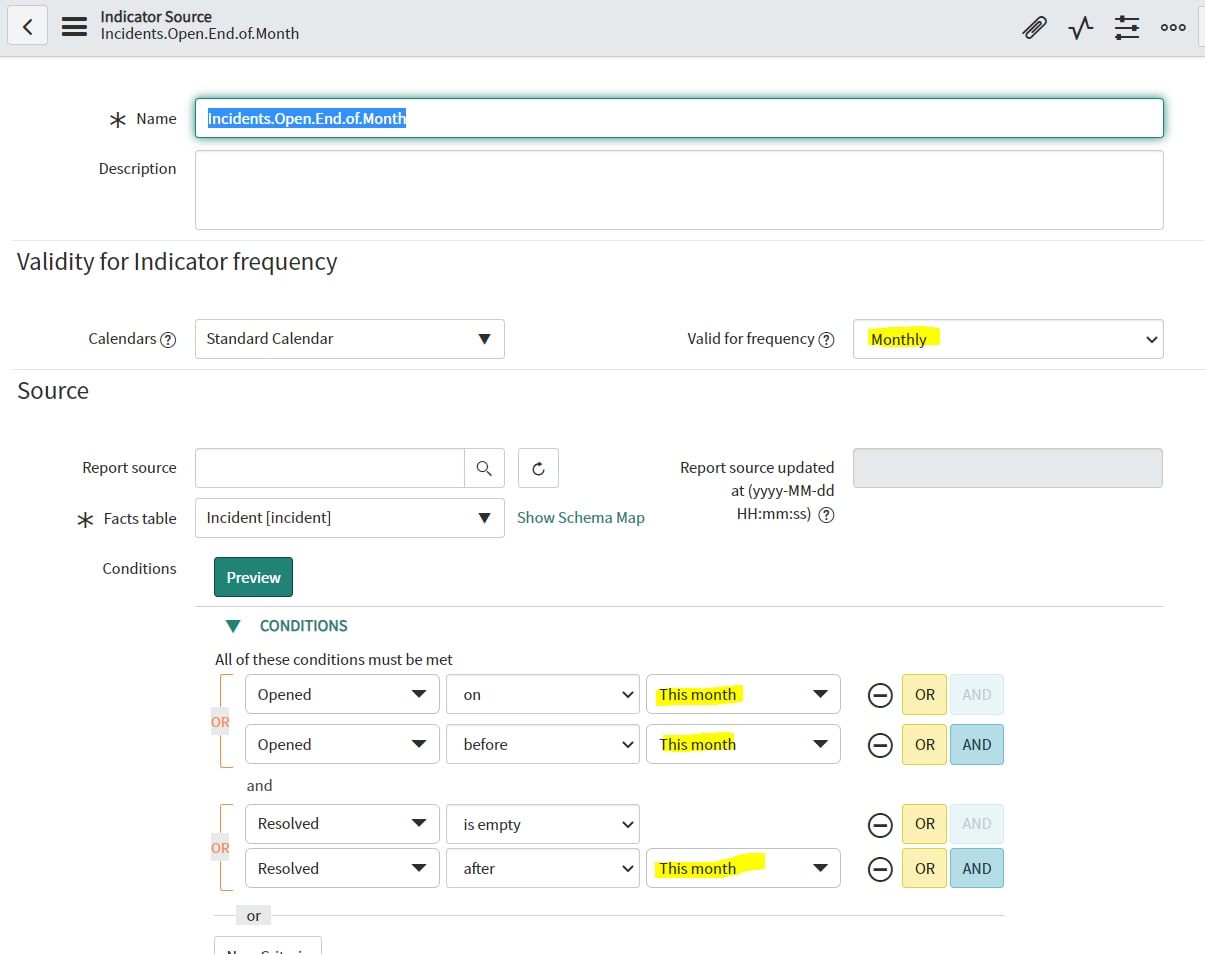
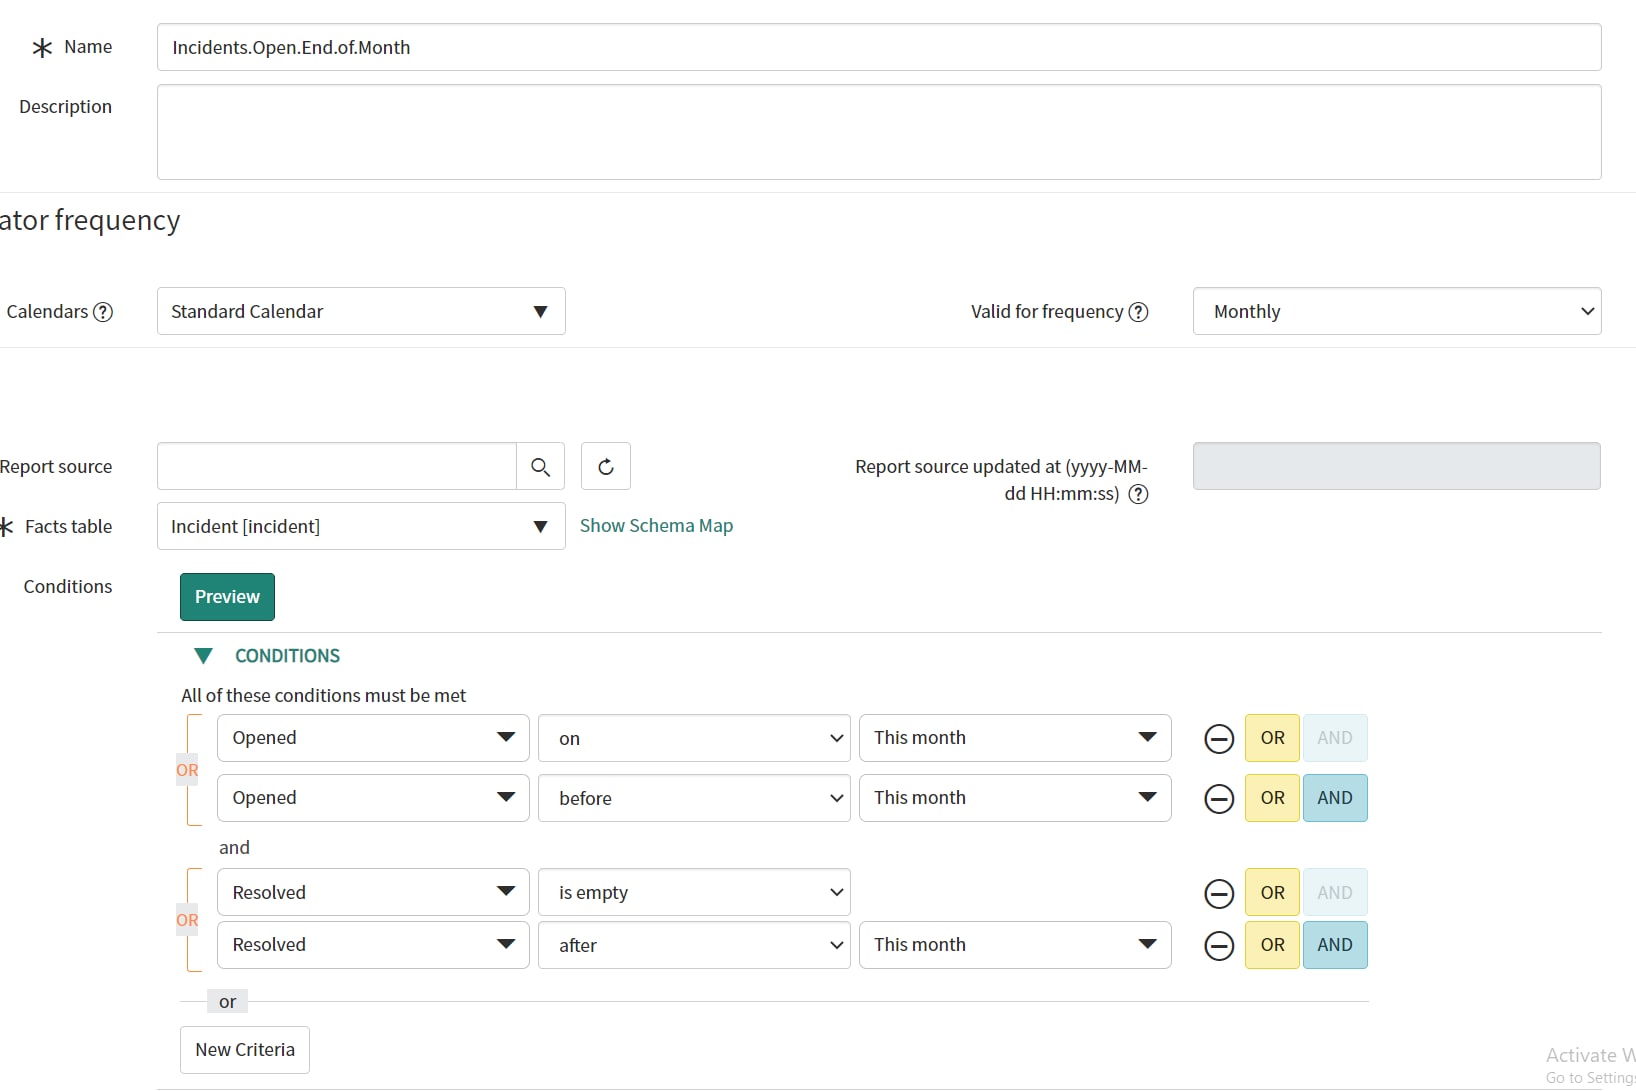
Set up a new monthly indicator source like this, with conditions looking at opened month and resolved month:

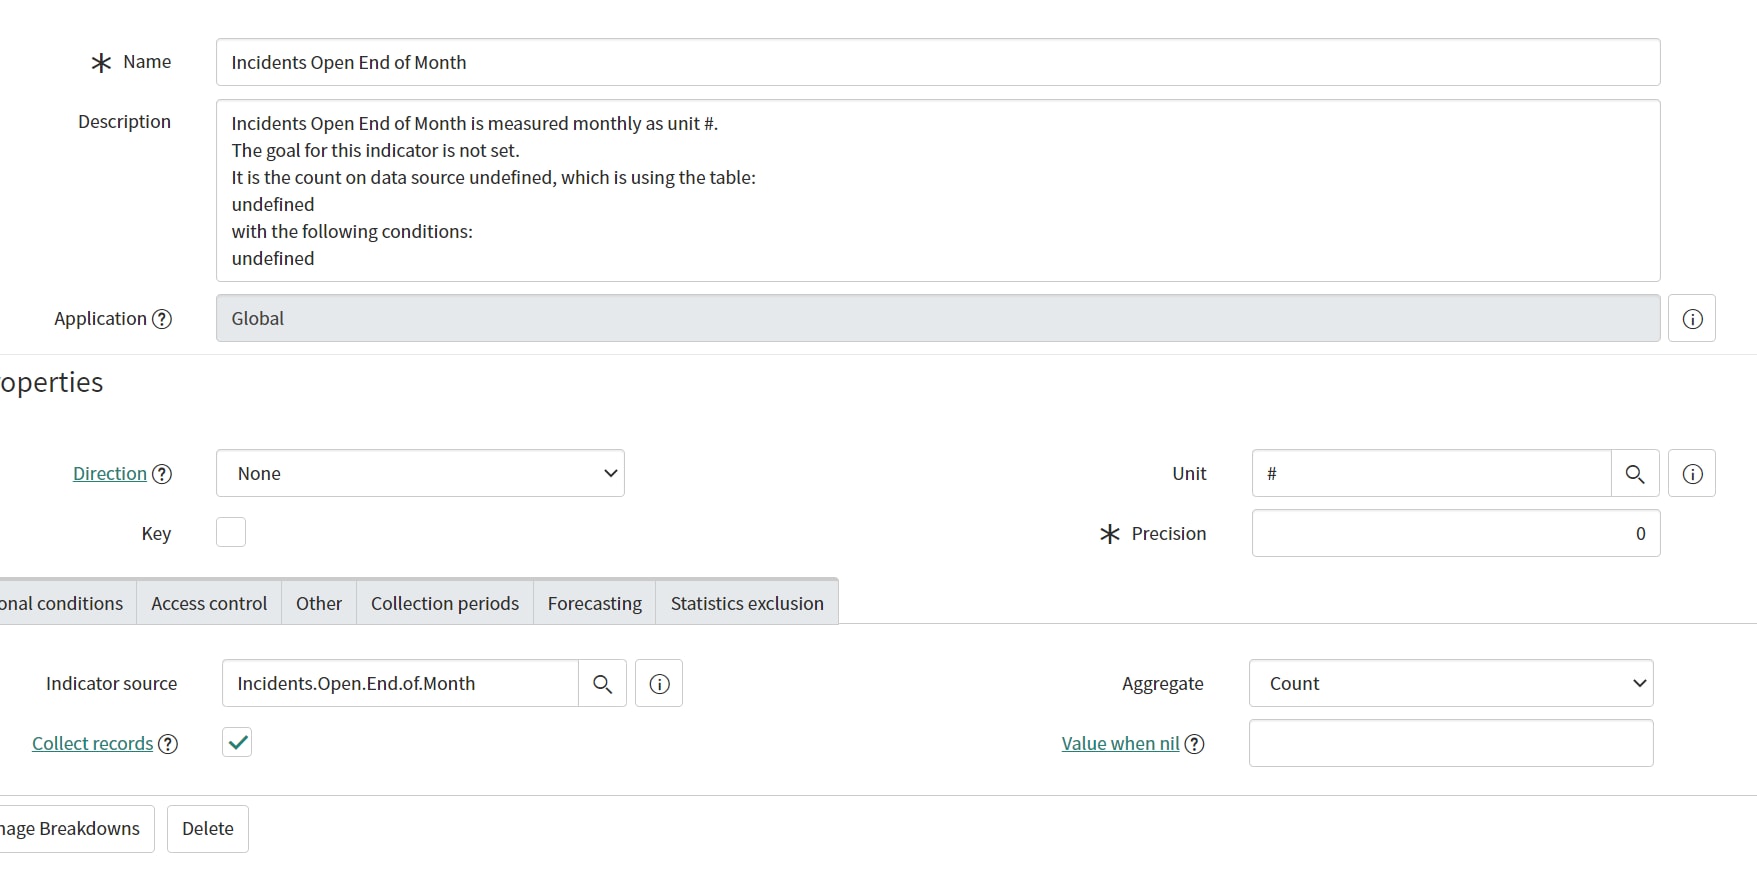
Then an automated indicator based on the source:

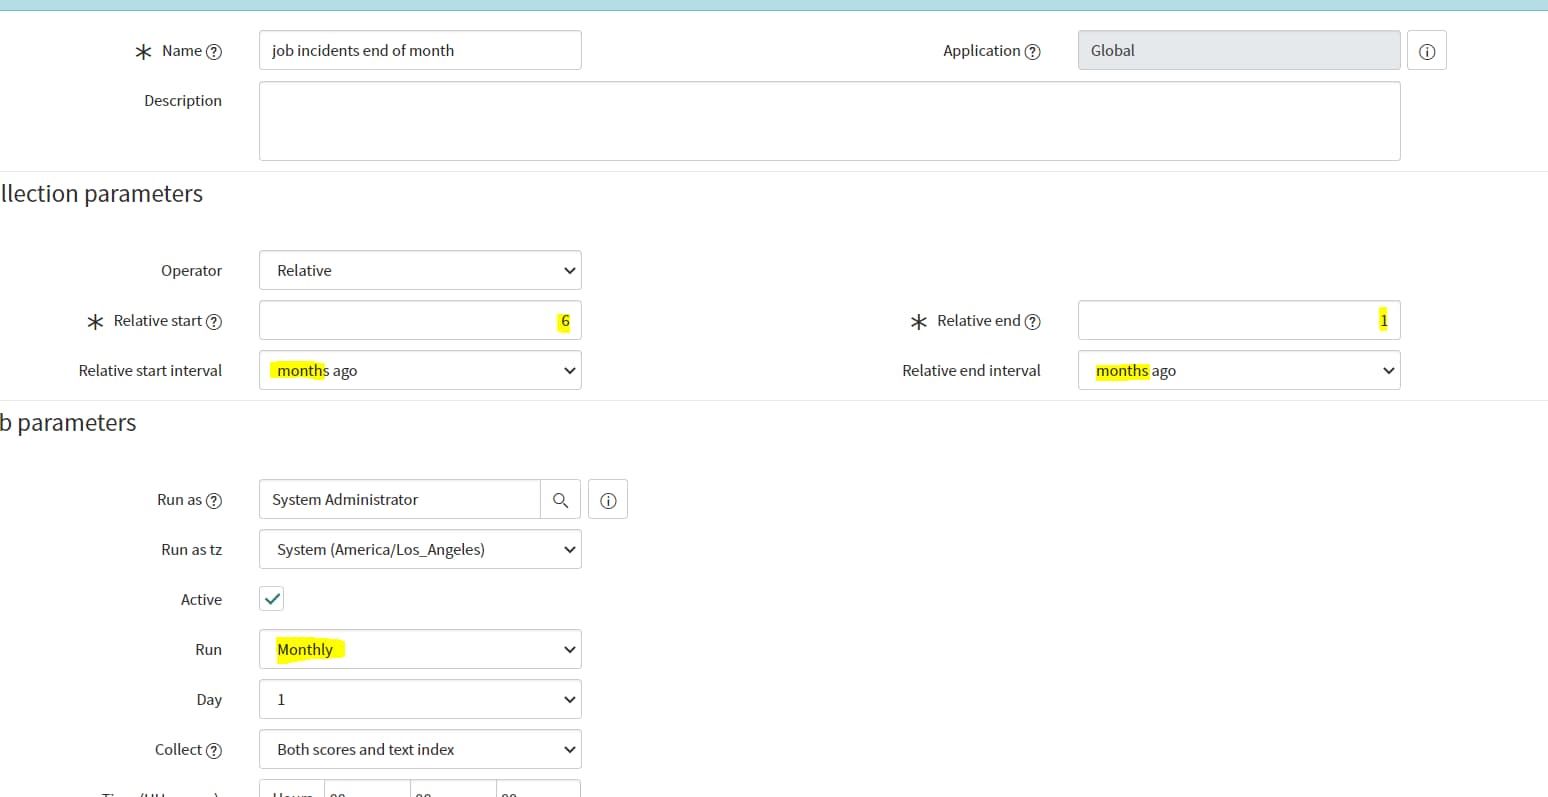
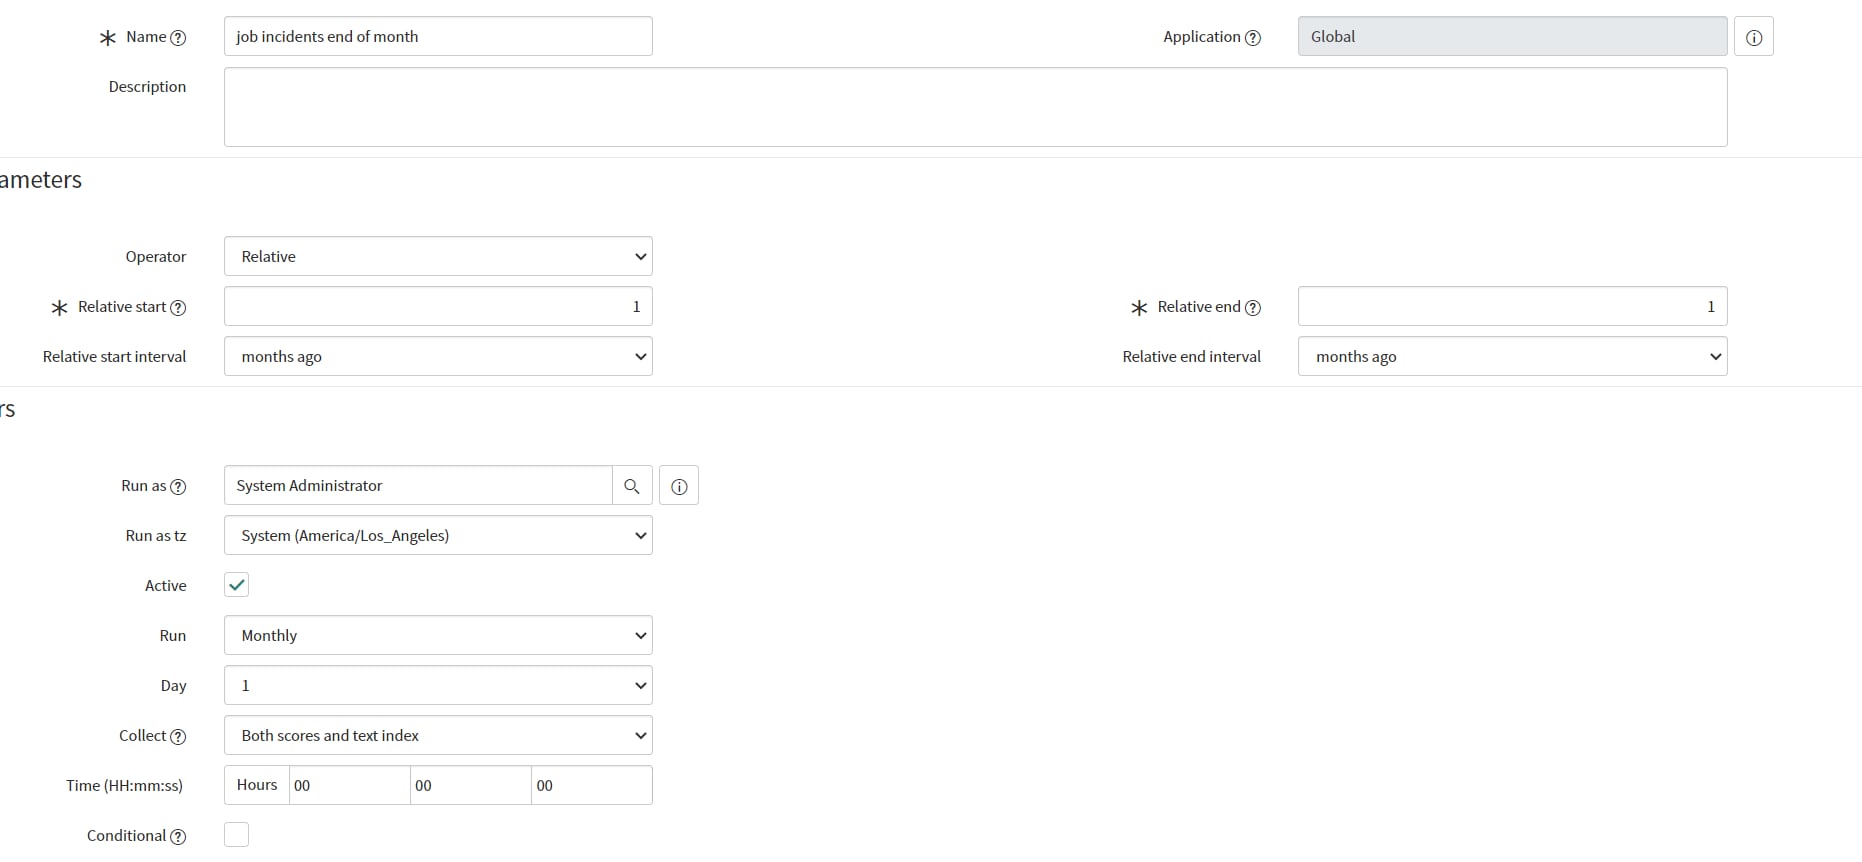
Finally you need a data collection job to run the first day of every month. It will collect records for the previous month. Meaning you get the snapshot for 2021-02-28 as this job runs on 2021-03-01:

Now you can add the indicator to a time series widget. Then add the OOTB indicators "Number of new incidents" and "Number of resolved incidents" as secondary indicators in the widget, with a "By Month SUM" time series:

Hope this answers your question, if so please mark it as correct.
- Mark as New
- Bookmark
- Subscribe
- Mute
- Subscribe to RSS Feed
- Permalink
- Report Inappropriate Content
03-17-2021 09:12 AM
Hello NikEng
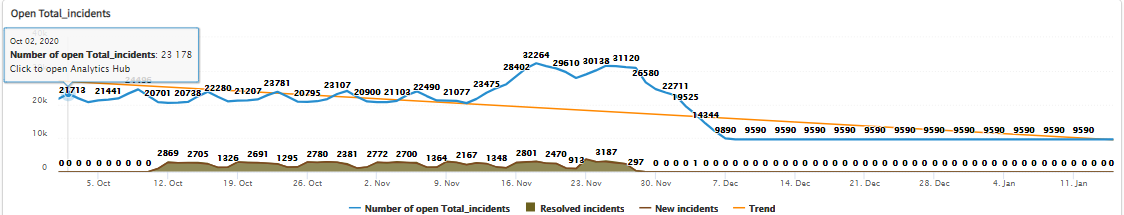
This was really helpful. I understand the monthly snapshot idea. I followed the steps. I'm already getting the number of resolved and new incident by month sum. I expect I will get a value on Apr1 for the open tickets on Mar 31, but how to get the "historical value" (I mean getting the number of open ticket at Feb 28th, Jan 31th, DEc 31th etc... ?
Running a historical job already defined is giving me a day per day value, but is not really what I want
Any idea ?
