How to get survey results with each response as 1 row and answer to each question as columns?
- Mark as New
- Bookmark
- Subscribe
- Mute
- Subscribe to RSS Feed
- Permalink
- Report Inappropriate Content
08-07-2018 03:15 AM
We need to extract the results of one of our surveys. Each response should be on a row with answers to questions as columns. You can easily extract in this format for Google Forms and Microsoft Forms which actually makes more sense since you will have a lot of questions and a lot of responses.
Our issue is if we get for example 5000 responses and we have 10 questions, the number of rows when you want to extract the raw survey result data gets extremely large. Because of this problem, we now need to manually change the rows limit when extracting or extract result per question and manually rebuild them on a spreadsheet to get the expected output.
Expected output:

ServiceNow output:

Number of rows if you have 10 questions and 5000 survey respondents:
10 rows per respondent * 5000 respondents = 50,000 rows (THIS IS THE PROBLEM)
Take note that this is just for a 10 question survey.
- Labels:
-
Reporting
- Mark as New
- Bookmark
- Subscribe
- Mute
- Subscribe to RSS Feed
- Permalink
- Report Inappropriate Content
08-07-2018 07:38 AM


- Mark as New
- Bookmark
- Subscribe
- Mute
- Subscribe to RSS Feed
- Permalink
- Report Inappropriate Content
08-08-2018 12:48 AM
What did you do for those non numeric answers? Like comments for example.
- Mark as New
- Bookmark
- Subscribe
- Mute
- Subscribe to RSS Feed
- Permalink
- Report Inappropriate Content
08-08-2018 05:42 AM
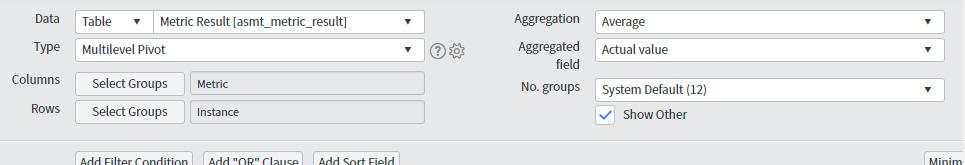
We have a separate, List type report on the asmt_metric_result table which shows the Survey Instance number and the String value of the comment.
You could do a combination of the above Pivot Table report plus the List report and put them together outside of the platform (eg. in Excel).
- Mark as New
- Bookmark
- Subscribe
- Mute
- Subscribe to RSS Feed
- Permalink
- Report Inappropriate Content
02-25-2020 09:43 PM
Hi Nia - in case you are keen to have this functionality supported out of the box, kindly check the idea I posted on the new ServiceNow Idea Portal here. It would be best if you can vote it up and provide a comment on the business value this functionality will bring so ServiceNow can prioritize its development.