median on performance analytics
- Mark as New
- Bookmark
- Subscribe
- Mute
- Subscribe to RSS Feed
- Permalink
- Report Inappropriate Content
01-22-2016 09:09 AM
We are starting to migrate our metrics and KPIs in to ServiceNow Performance Analytics. We have encountered 2 blocking items from being able to do a full migration and I am hoping that someone here has found a way to address these calculations.
1. Calculating Medians
We have a number of metrics that are not averages, but are medians. Has anyone been able to calculate a median using PA and how have they done it?
2. Percentile Calculations
We also have a number of KPIs that are X% completed in Y Days. I know that you can do this in Excel (and I have included some information I have found about the Excel method to calculate), but how can you do this in PA?
Microsoft Excel method to calculate Percentile (with examples)
. Here, 
.
Firstly, the rank is calculated

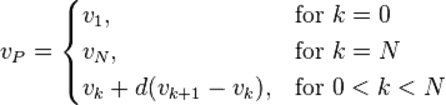
Then the rank is split into its integer component k and decimal component d, such that
Then the rank is
is calculated as:


First worked example of the Microsoft Excel method[edit]
Consider the ordered list {15,20, 35, 40, 50}, which contains five data values. What is the 40th percentile of this list using the Microsoft Excel method?
First we calculate the rank of the 40th percentile as follows:

So n=2.6, which gives us k=2 and d=0.6. So the value of the 40th percentile is calculated as:

So the value of the 40th percentile of the ordered list {15, 20, 35, 40, 50} using the Microsoft Excel method is 29
Second worked example of the Microsoft Excel method[edit]
Consider the ordered list {1,2,3,4} which contains four data values. What is the 75th percentile of this list using the Microsoft Excel method?
First we calculate the rank of the 75th percentile as follows:

So n=3.25, which gives us k=3 and d=0.25. So the value of the 75th percentile is calculated as:

So the value of the 75th percentile of the ordered list {1,2,3,4} using the Microsoft Excel method is 3.25
- Labels:
-
Performance Analytics
- Mark as New
- Bookmark
- Subscribe
- Mute
- Subscribe to RSS Feed
- Permalink
- Report Inappropriate Content
02-14-2016 08:26 AM
To calculate something like this you'll have to script into a bucket group. For instance set up a bucket (bucket group module) to capture the potential values. Set your starting values and end value ranges e.g. 0 - 5 , 5 -20 , 20 -100, 100 +. Then we will need to script calculate your median so under the script module you need to select the field(s) that we are doing the calculations against e.g. v1 , v2 etc. Then you can script out your function. Ill try and test and get back to you; however, the process is what i explained above. Unless someone else has another idea.
Tone
- Mark as New
- Bookmark
- Subscribe
- Mute
- Subscribe to RSS Feed
- Permalink
- Report Inappropriate Content
06-14-2016 02:05 PM
did anyone ever figure out or share how to do percentiles on PA?
- Mark as New
- Bookmark
- Subscribe
- Mute
- Subscribe to RSS Feed
- Permalink
- Report Inappropriate Content
06-15-2016 01:24 AM
Hi Mike,
If it is to calculate something like "X% completed in Y Days", I think you would need an indicator that collects the "number of completed" [A] and and indicator that collects the "number of completed in Y days" [B]. Then use a formula indicator to calculate the percentage: [B] / [A] *100. And set a target for X.
To have more buckets of Y (for example 1, 3, 5, 10, 15> days), I would suggest to add a 'completion age bucket' breakdown to indicator "number of completed", and then have several formulas to calculate the "X% completed in Y Days" for each completion age bucket: [B][Bucket: 10 days] / [A] *100.
I am not sure this answers the more generic "percentiles" question.
Best regards,
Erik
- Mark as New
- Bookmark
- Subscribe
- Mute
- Subscribe to RSS Feed
- Permalink
- Report Inappropriate Content
09-28-2020 08:26 PM
It seems that Median is still not native in ServiceNow Performance Analytics. Has anyone found a(n elegant) way to implement it?