median on performance analytics
- Mark as New
- Bookmark
- Subscribe
- Mute
- Subscribe to RSS Feed
- Permalink
- Report Inappropriate Content
01-22-2016 09:09 AM
We are starting to migrate our metrics and KPIs in to ServiceNow Performance Analytics. We have encountered 2 blocking items from being able to do a full migration and I am hoping that someone here has found a way to address these calculations.
1. Calculating Medians
We have a number of metrics that are not averages, but are medians. Has anyone been able to calculate a median using PA and how have they done it?
2. Percentile Calculations
We also have a number of KPIs that are X% completed in Y Days. I know that you can do this in Excel (and I have included some information I have found about the Excel method to calculate), but how can you do this in PA?
Microsoft Excel method to calculate Percentile (with examples)
. Here, 
.
Firstly, the rank is calculated

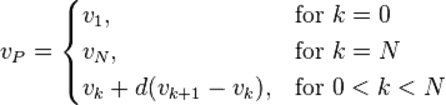
Then the rank is split into its integer component k and decimal component d, such that
Then the rank is
is calculated as:


First worked example of the Microsoft Excel method[edit]
Consider the ordered list {15,20, 35, 40, 50}, which contains five data values. What is the 40th percentile of this list using the Microsoft Excel method?
First we calculate the rank of the 40th percentile as follows:

So n=2.6, which gives us k=2 and d=0.6. So the value of the 40th percentile is calculated as:

So the value of the 40th percentile of the ordered list {15, 20, 35, 40, 50} using the Microsoft Excel method is 29
Second worked example of the Microsoft Excel method[edit]
Consider the ordered list {1,2,3,4} which contains four data values. What is the 75th percentile of this list using the Microsoft Excel method?
First we calculate the rank of the 75th percentile as follows:

So n=3.25, which gives us k=3 and d=0.25. So the value of the 75th percentile is calculated as:

So the value of the 75th percentile of the ordered list {1,2,3,4} using the Microsoft Excel method is 3.25
- Labels:
-
Performance Analytics
- Mark as New
- Bookmark
- Subscribe
- Mute
- Subscribe to RSS Feed
- Permalink
- Report Inappropriate Content
02-22-2021 08:02 AM
Not yet. Not that I'm aware of...