Need to get a report showing the count of tickets resolved by each assignment group monthly
- Mark as New
- Bookmark
- Subscribe
- Mute
- Subscribe to RSS Feed
- Permalink
- Report Inappropriate Content
05-10-2017 11:42 AM
I would like to get a report which shows the following data:
Tickets opened in the month of January, February, March and resolved by each assignment group.
If possible, I would like to get this in a pivot table where in horizontal rows shows the assignment groups and vertical columns shows the months (Jan, Feb, etc)
Please advice how I can get such a report. I have tried getting the data but could not include month wise filter in the report.
Please help
Thanks,
Gopi
- Labels:
-
Dashboard
- Mark as New
- Bookmark
- Subscribe
- Mute
- Subscribe to RSS Feed
- Permalink
- Report Inappropriate Content
05-10-2017 11:55 AM

- Mark as New
- Bookmark
- Subscribe
- Mute
- Subscribe to RSS Feed
- Permalink
- Report Inappropriate Content
05-17-2017 04:57 AM
Hello Alikutty,
Thank you for your guidance. However I would like to know some more things here:
How can i insert Assignment group data over here? The actual requirement is to know the tickets resolved by each group in Jan, Feb, etc
It would be much better if i can show the Assignment groups as horizontal rows and Months as vertical columns (like in a pivot table).
Thanks,
Gopi
- Mark as New
- Bookmark
- Subscribe
- Mute
- Subscribe to RSS Feed
- Permalink
- Report Inappropriate Content
05-10-2017 12:02 PM
Two ways I see this working:
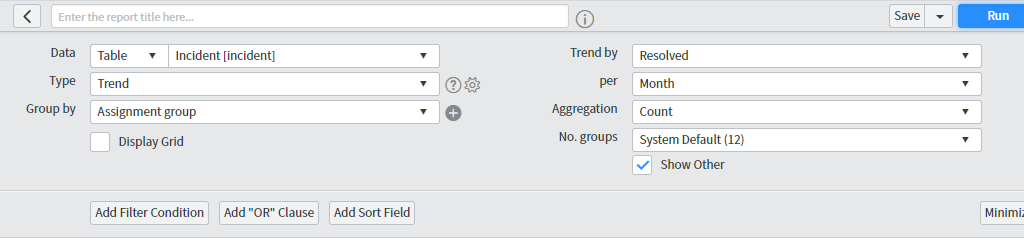
1. Create a new column on the task table for closure month. Populate the field at close time using a business rule and the GlideDateTime API.
2. Use the out-of-box Performance Analytics for Incident Management plugin that comes with all new installs of ServiceNow since Eureka. (If you are an older customer you would need to activate the plugin)
The Performance Analytics comes with an automated indicator setup already for Number of Resolved Incidents.
Number of resolved incidents
by priority
by category
by assignment group
See the instructions in the following Wiki article on how to set it up. But basically all you need to do is run the Historical Data Collection job and then activate the daily job going forward.

- Mark as New
- Bookmark
- Subscribe
- Mute
- Subscribe to RSS Feed
- Permalink
- Report Inappropriate Content
05-10-2017 12:04 PM
Whoops, you wanted by pivot. Here is something very close:

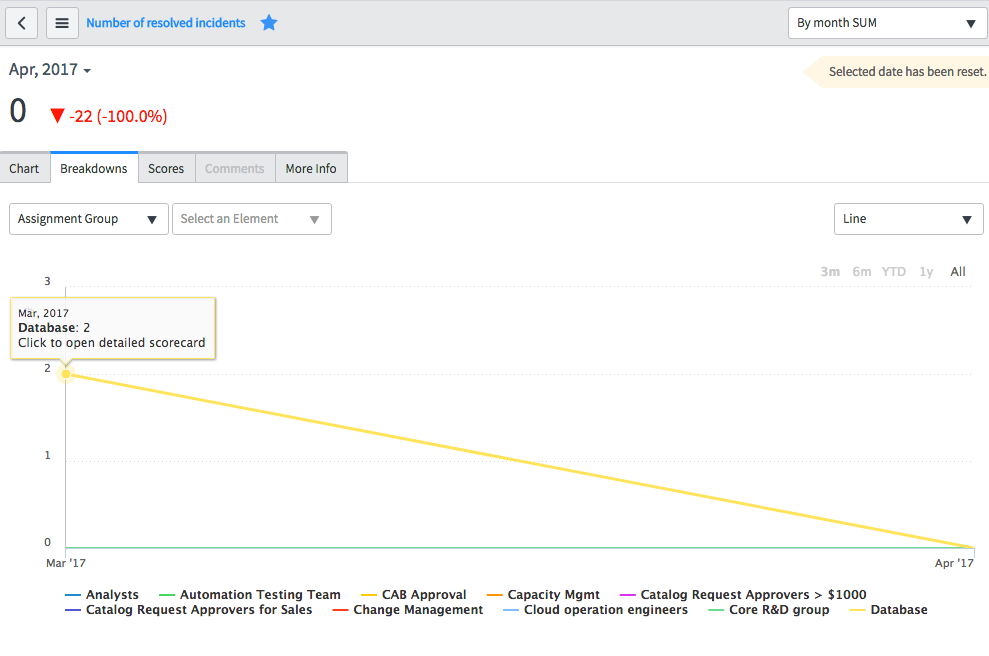
If you take the time to learn the Performance Analytics tool I think you will find it is incredibly powerful. It allows slicing an dicing on changing values and sub-filtering on the fly from breakdown charts and drilling down to details in one UI.
You can get Performance Analytics for Incident Management for free.
Context: The ABCs of Performance Analytics - Part 2 - part 2 of a very helpful 3 part discussion about using Performance Analytics to drive KPI's, including MTTR, backlog and many more.
Moneyball for Enterprise Service Management (ServiceNow) - Another discussion about how Performance Analytics enables deep insight into KPI's including MTTR.