- Mark as New
- Bookmark
- Subscribe
- Mute
- Subscribe to RSS Feed
- Permalink
- Report Inappropriate Content
05-13-2025 01:23 AM
I want to create a trend report to show how many new incidents were created each month. However, the records show that incidents created in previous months are included, and some of the incidents created in that month are not included.
The Indicator Source condition I'm using is "Created on Today," and the frequency is Daily.
The collection parameters for the Job schedule: relative start interval 12 months ago and relative end interval 1 day ago.
What is wrong with my conditions and how can I fix this?
Example as per screenshot:
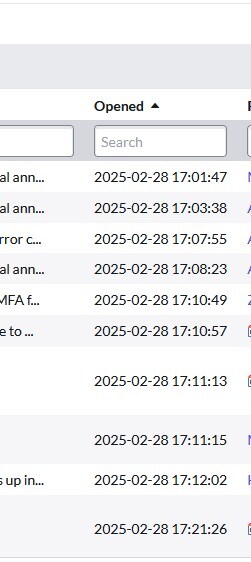
On March it shows they are 11603 incidents created. when click on the Analytic Hub, it shows that tickets that were opened on Feb are also there.
Solved! Go to Solution.
- Mark as New
- Bookmark
- Subscribe
- Mute
- Subscribe to RSS Feed
- Permalink
- Report Inappropriate Content
05-20-2025 12:09 AM
Hi All,
I’ve found the cause of the issue.
It was due to my job parameters running in my local time zone, which led to the discrepancy.
Thanks, everyone, for your replies!
- Mark as New
- Bookmark
- Subscribe
- Mute
- Subscribe to RSS Feed
- Permalink
- Report Inappropriate Content
05-13-2025 02:36 AM
Hi @hidzirf
Your requirement can be achieved using basic reporting/data visualization. There is no need for indicators.

Regards,
Siva
- Mark as New
- Bookmark
- Subscribe
- Mute
- Subscribe to RSS Feed
- Permalink
- Report Inappropriate Content
05-13-2025 07:22 AM
Hi @J Siva , thank you for your reply. Yes, I know I can easily create the trend using basic reporting, and I already have it. I'm asking because I'm creating an insight for my department to show incidents inflow and outflow, and there is a need for me to display it in one visualization using PA.
- Mark as New
- Bookmark
- Subscribe
- Mute
- Subscribe to RSS Feed
- Permalink
- Report Inappropriate Content
05-13-2025 12:47 PM
When you drill into that month, what do your breadcrumbs show? This will tell you the search criteria it is applying....good start.
To Siva's point you can build that same report by simply adding the Incident table as two different data sources (filtering one by state to capture only closed/resolved):

- Mark as New
- Bookmark
- Subscribe
- Mute
- Subscribe to RSS Feed
- Permalink
- Report Inappropriate Content
05-19-2025 11:26 PM
Dear @TheJoeDC ,
I’ve tried drilling down into the data. Most of the incidents from the end of the previous month are appearing in the current month. For example, I can see a few tickets created on April 30th showing up in May, but not all of them. I checked to see if those tickets were resolved and then reopened, but that’s not the case.
I need to create a few indicators to track the movement of incidents—not just created or resolved. These include ticket creation, tickets transferred out, tickets resolved within the group, etc. That’s why I can’t rely on basic reporting or visualization.