- Mark as New
- Bookmark
- Subscribe
- Mute
- Subscribe to RSS Feed
- Permalink
- Report Inappropriate Content
08-19-2020 11:46 AM
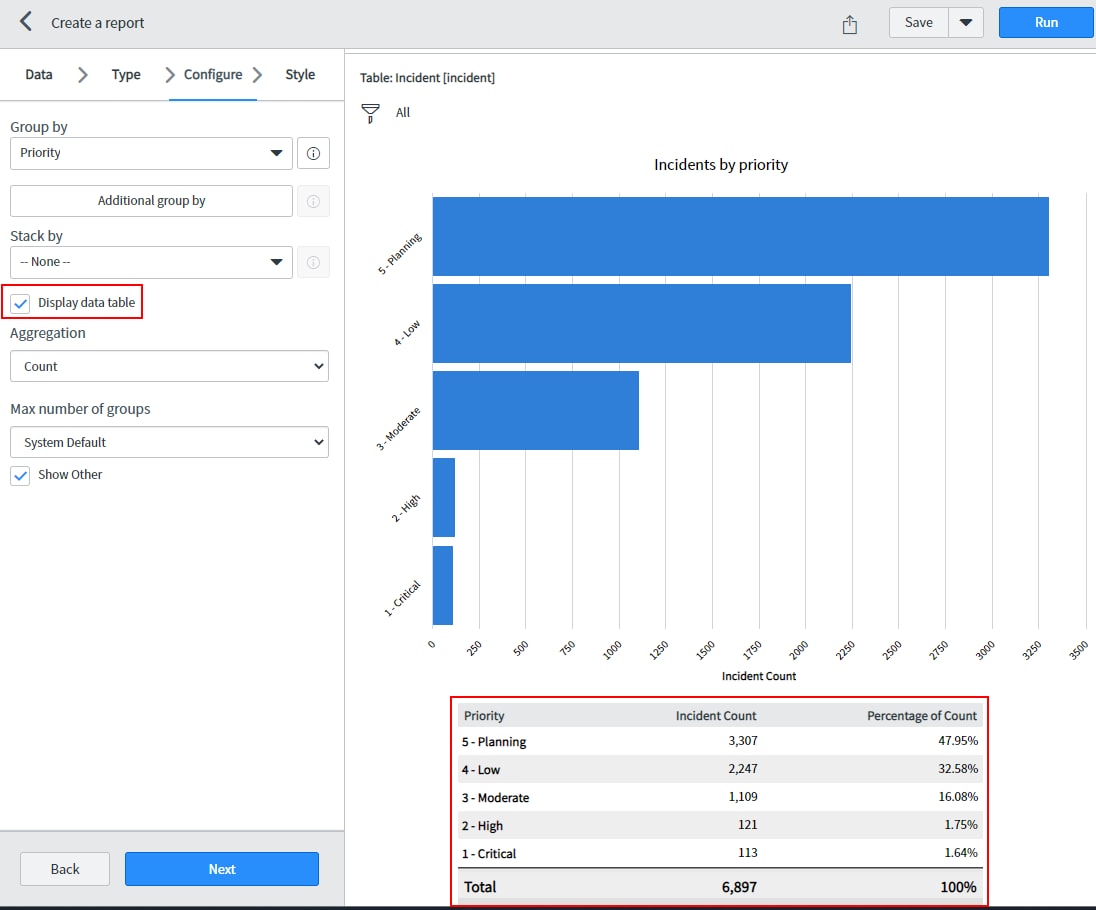
Is there a way to only show the data table instead of the graph for reports? Specifically, I have a horizontal bar report, and I'm only interested in the table that is displayed when "Display data table" is selected in the report designer. This report would show up in a dashboard.

Solved! Go to Solution.
- Labels:
-
Dashboard
-
Performance Analytics
-
Reporting
- Mark as New
- Bookmark
- Subscribe
- Mute
- Subscribe to RSS Feed
- Permalink
- Report Inappropriate Content
02-10-2021 09:09 AM
You can achieve this by setting a custom size for the graph you're using.

- Mark as New
- Bookmark
- Subscribe
- Mute
- Subscribe to RSS Feed
- Permalink
- Report Inappropriate Content
08-19-2020 11:57 AM
You can uncheck "display grid" checkbox.
Please mark my response as correct and helpful if it helped solved your question.
-Thanks
- Mark as New
- Bookmark
- Subscribe
- Mute
- Subscribe to RSS Feed
- Permalink
- Report Inappropriate Content
08-20-2020 11:12 AM
Thanks Prateek. This gave me a clue of visually de-emphasizing the bar graph so users also focus on the data table, but it's not quite what I was looking for.
- Mark as New
- Bookmark
- Subscribe
- Mute
- Subscribe to RSS Feed
- Permalink
- Report Inappropriate Content
08-20-2020 12:05 PM
I understand, but that is the closest we can achieve today in the platform
Please mark my response as correct and helpful if it helped solved your question.
-Thanks
- Mark as New
- Bookmark
- Subscribe
- Mute
- Subscribe to RSS Feed
- Permalink
- Report Inappropriate Content
02-22-2024 10:01 AM
When I add the report to the Dashboard it goes back to the default view.
How do I show the Data table on the dashboard.
It seems the dashboard will not allow me to resize the report to show both the barchart and data table.