- Mark as New
- Bookmark
- Subscribe
- Mute
- Subscribe to RSS Feed
- Permalink
- Report Inappropriate Content
08-19-2020 11:46 AM
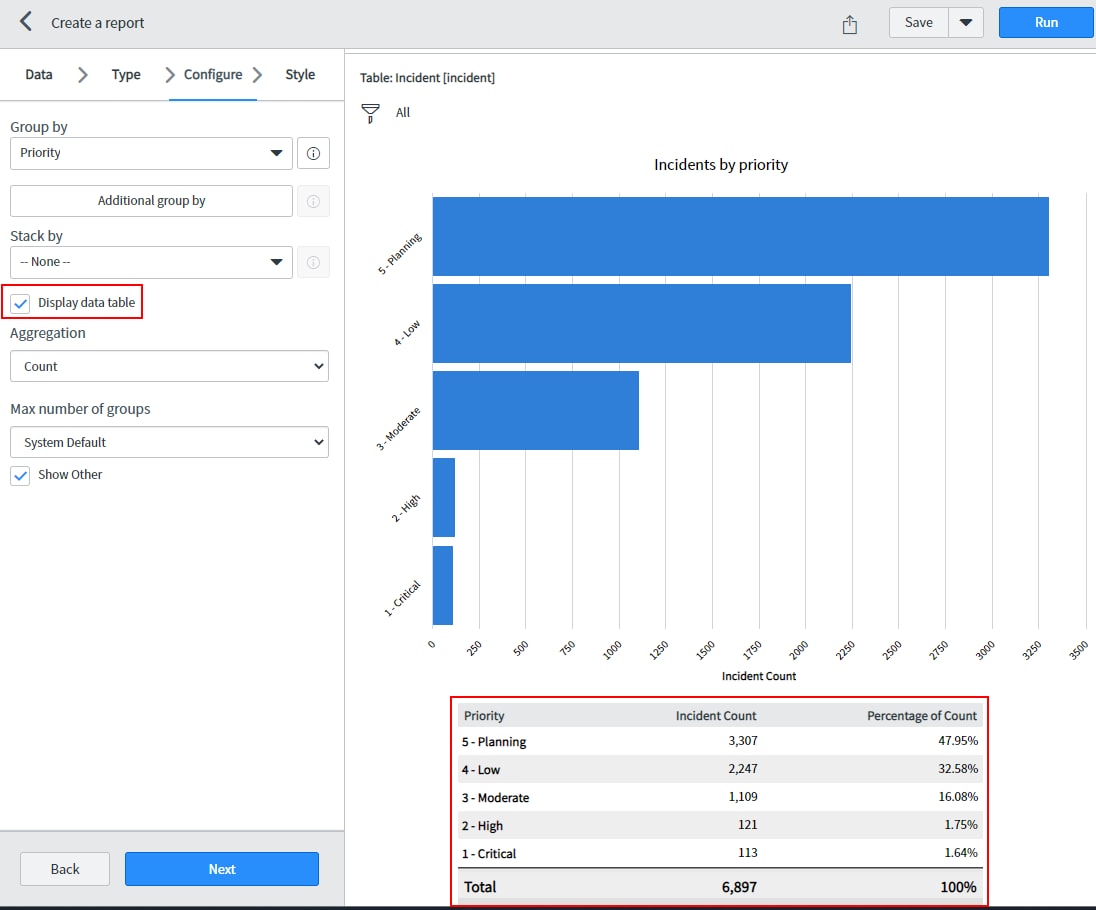
Is there a way to only show the data table instead of the graph for reports? Specifically, I have a horizontal bar report, and I'm only interested in the table that is displayed when "Display data table" is selected in the report designer. This report would show up in a dashboard.

Solved! Go to Solution.
- Labels:
-
Dashboard
-
Performance Analytics
-
Reporting
- Mark as New
- Bookmark
- Subscribe
- Mute
- Subscribe to RSS Feed
- Permalink
- Report Inappropriate Content
02-10-2021 09:09 AM
You can achieve this by setting a custom size for the graph you're using.

- Mark as New
- Bookmark
- Subscribe
- Mute
- Subscribe to RSS Feed
- Permalink
- Report Inappropriate Content
08-31-2020 03:04 AM

- Mark as New
- Bookmark
- Subscribe
- Mute
- Subscribe to RSS Feed
- Permalink
- Report Inappropriate Content
02-10-2021 09:09 AM
- Mark as New
- Bookmark
- Subscribe
- Mute
- Subscribe to RSS Feed
- Permalink
- Report Inappropriate Content
02-11-2021 07:55 AM
This is exactly what I needed. Thanks Ajugovic!
- Mark as New
- Bookmark
- Subscribe
- Mute
- Subscribe to RSS Feed
- Permalink
- Report Inappropriate Content
11-11-2021 10:59 AM
Hi,
The above solution worked when viewed from the reports page but when the same report is used on a dashboard it still displays the pie/bar graph. Can that also be removed from the dashboard, if yes - is there any configuration that can be done?
Thanks in advance.
- Mark as New
- Bookmark
- Subscribe
- Mute
- Subscribe to RSS Feed
- Permalink
- Report Inappropriate Content
11-11-2021 11:16 AM
I don't believe that is possible currently. The only thing I can think of is after removing the graph/visual, you publish the report and use the link that's generated to view the report. The published report will also not display the graph.