- Mark as New
- Bookmark
- Subscribe
- Mute
- Subscribe to RSS Feed
- Permalink
- Report Inappropriate Content
08-19-2020 11:46 AM
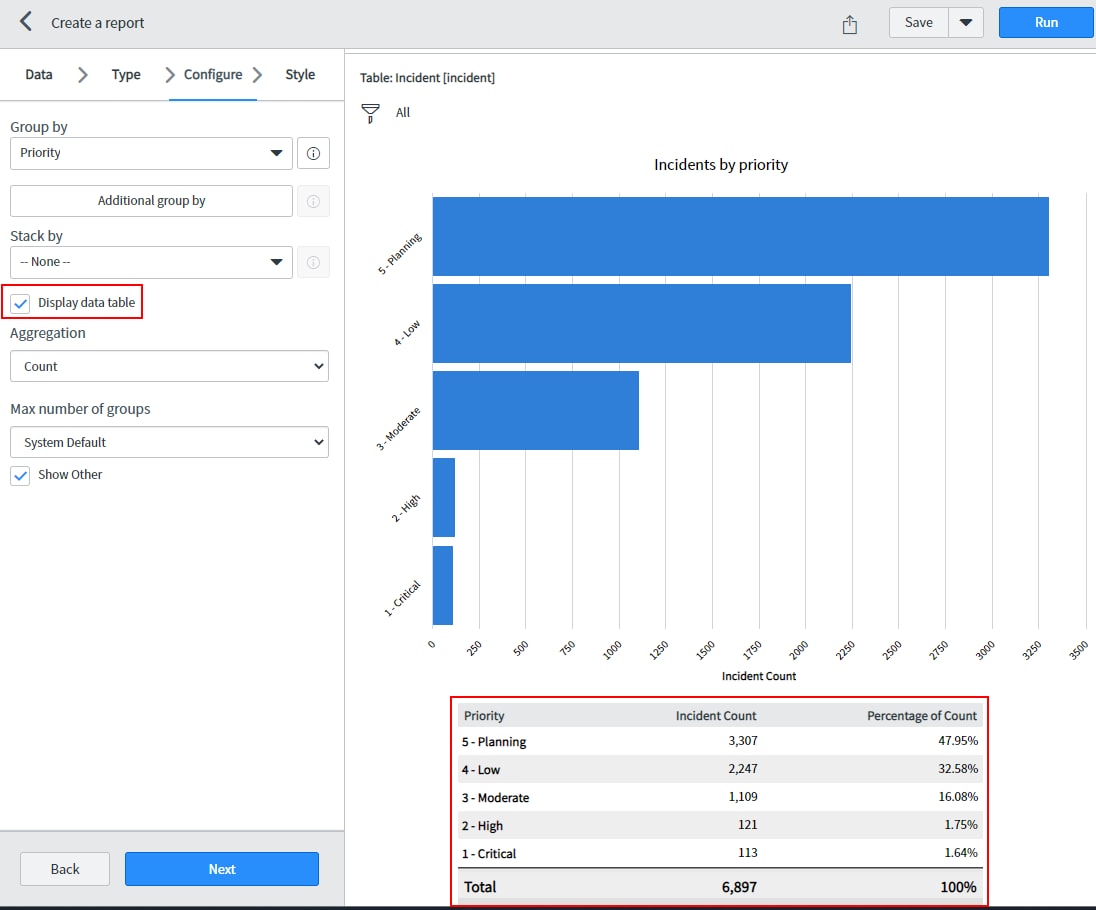
Is there a way to only show the data table instead of the graph for reports? Specifically, I have a horizontal bar report, and I'm only interested in the table that is displayed when "Display data table" is selected in the report designer. This report would show up in a dashboard.

Solved! Go to Solution.
- Labels:
-
Dashboard
-
Performance Analytics
-
Reporting
- Mark as New
- Bookmark
- Subscribe
- Mute
- Subscribe to RSS Feed
- Permalink
- Report Inappropriate Content
02-10-2021 09:09 AM
You can achieve this by setting a custom size for the graph you're using.

- Mark as New
- Bookmark
- Subscribe
- Mute
- Subscribe to RSS Feed
- Permalink
- Report Inappropriate Content
04-03-2024 12:02 PM
I'm having the same issue. I was really hopeful I finally found a work-around, but the Dashboard auto-sizing ruins it.
- Mark as New
- Bookmark
- Subscribe
- Mute
- Subscribe to RSS Feed
- Permalink
- Report Inappropriate Content
08-19-2020 12:38 PM
This is not possible, although I think it would make a great idea for a future release. Put in an Idea in the Idea Portal.
- Mark as New
- Bookmark
- Subscribe
- Mute
- Subscribe to RSS Feed
- Permalink
- Report Inappropriate Content
08-31-2020 03:06 AM
Seems like it's not possible at the moment as you mention. I've submitted the idea just in case. Thanks for the suggestion!
https://community.servicenow.com/community?id=view_idea&sysparm_idea_id=7bf00d18db8fd810fb115583ca9619f5&sysparm_idea_table=x_snc_com_ideation_idea&sysparm_module_id=enhancement_requests
- Mark as New
- Bookmark
- Subscribe
- Mute
- Subscribe to RSS Feed
- Permalink
- Report Inappropriate Content
08-20-2020 11:19 AM

- Mark as New
- Bookmark
- Subscribe
- Mute
- Subscribe to RSS Feed
- Permalink
- Report Inappropriate Content
08-20-2020 12:23 PM
Hi Tushar,
Can that be used to show priorities 1 to 5 as rows and a column with the incidents that have each of those priority values? Something similar to the table in my original question (percentage column and the totals are not that important).