- Mark as New
- Bookmark
- Subscribe
- Mute
- Subscribe to RSS Feed
- Permalink
- Report Inappropriate Content
08-19-2020 11:46 AM
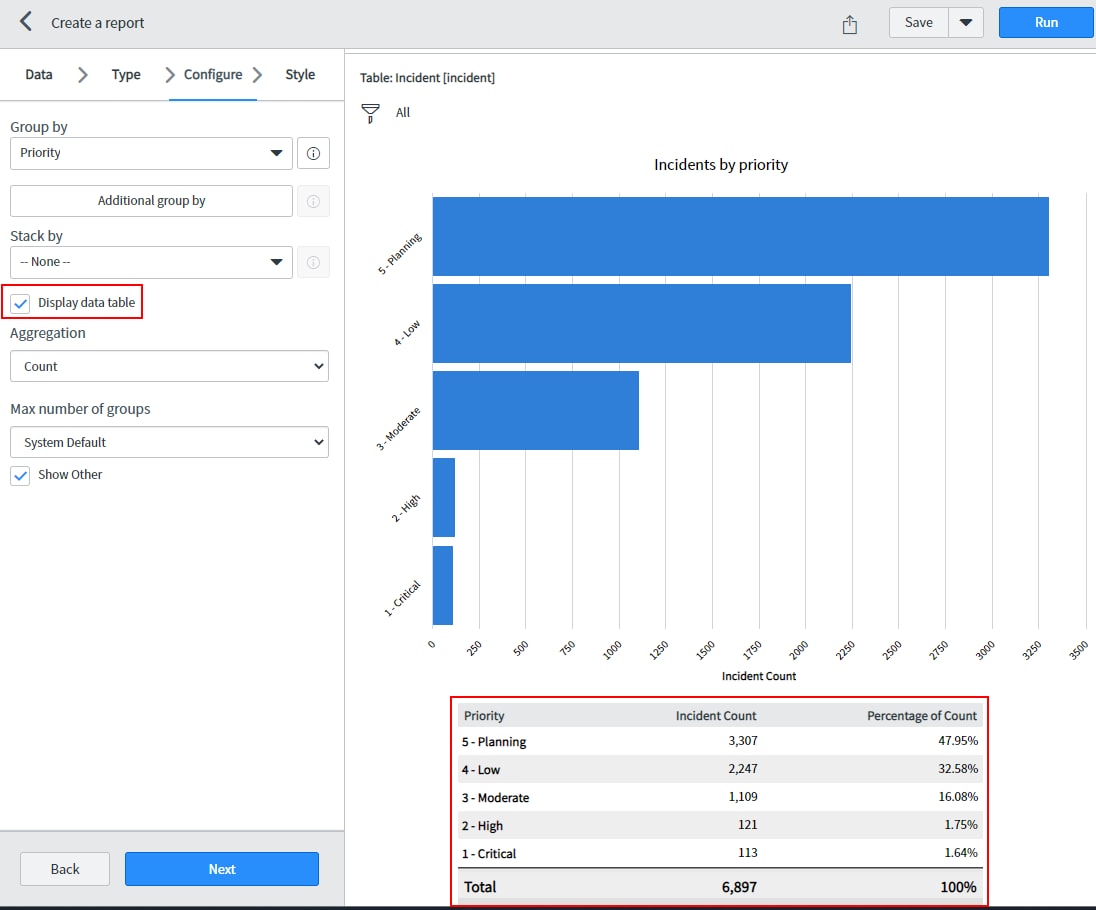
Is there a way to only show the data table instead of the graph for reports? Specifically, I have a horizontal bar report, and I'm only interested in the table that is displayed when "Display data table" is selected in the report designer. This report would show up in a dashboard.

Solved! Go to Solution.
- Labels:
-
Dashboard
-
Performance Analytics
-
Reporting
- Mark as New
- Bookmark
- Subscribe
- Mute
- Subscribe to RSS Feed
- Permalink
- Report Inappropriate Content
02-10-2021 09:09 AM
You can achieve this by setting a custom size for the graph you're using.

- Mark as New
- Bookmark
- Subscribe
- Mute
- Subscribe to RSS Feed
- Permalink
- Report Inappropriate Content
05-20-2024 02:18 PM
@Aaron Munoz - any movement on your idea request? I'm also looking for this functionality with a very particular customer.
- Mark as New
- Bookmark
- Subscribe
- Mute
- Subscribe to RSS Feed
- Permalink
- Report Inappropriate Content
06-11-2024 07:16 AM
I tried the abouve with the semi donut and was able to hide the chart in the dashboard. Donut with 0. For me after that is only shows the data table
