- Mark as New
- Bookmark
- Subscribe
- Mute
- Subscribe to RSS Feed
- Permalink
- Report Inappropriate Content
12-17-2018 09:01 AM
Hi!
I'm having problems with a heatmap widget not showing any data, despite the data being listed in the indicator scorecard for both breakdowns.
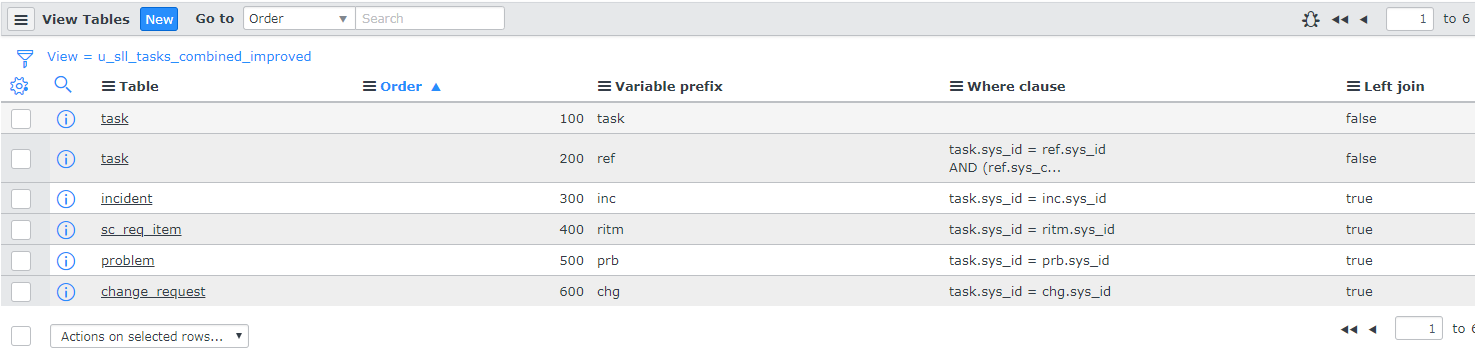
So what I have is a database view that I use in the indicator source. This is a joined view with the task table joined to incident, requested item, problem and change. Basically a list of all records joined by their sysids and sys_class_name.

This table works fine. I've got an indicator source that successfully pulls data from it.
The indicator counts the open records for that source, this also works fine.
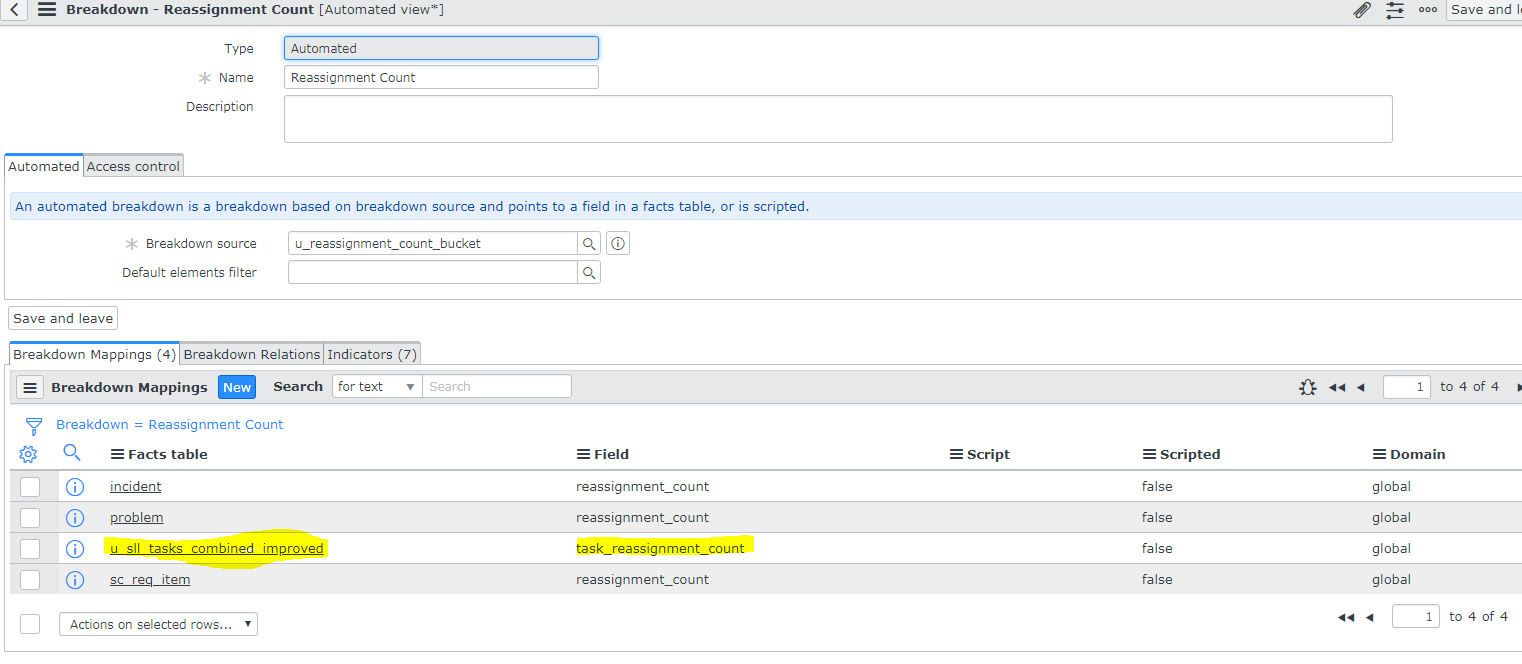
I've got two breakdowns for this indicator, reassignment count and task type. Reassignment count is a bucket group breakdown.

As for the task type, it gets a little more complicated. The breakdown source for this is sys_db:object.

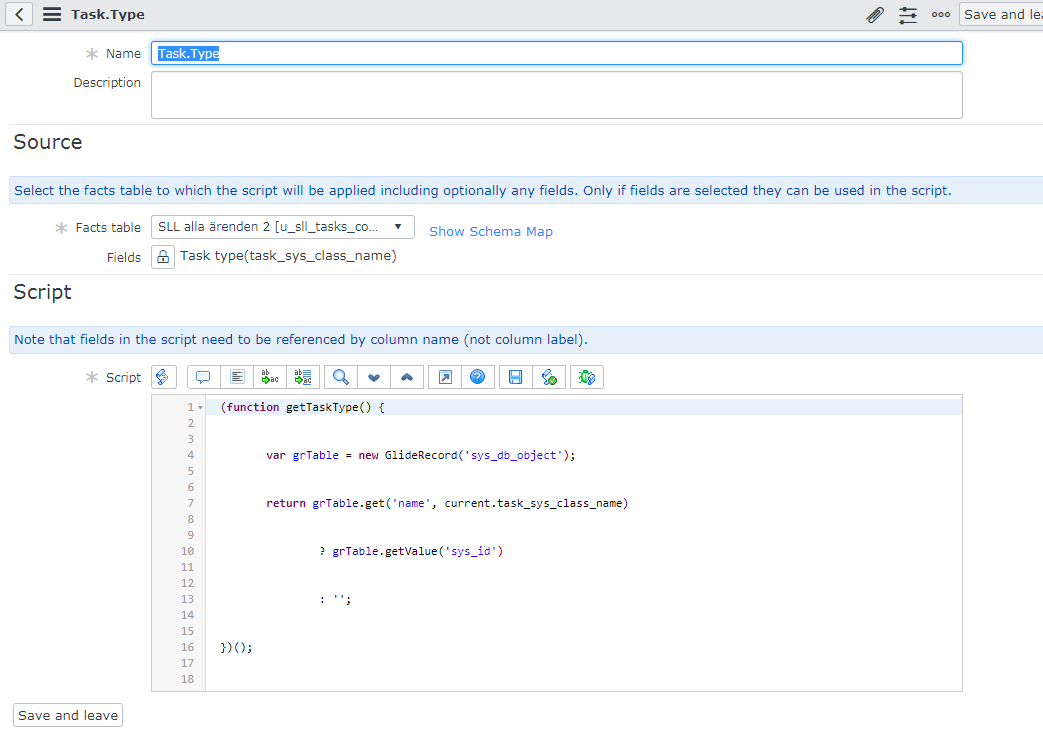
But since this gives the sysid, while the database view contains the sys_class_name, I've got a script to match these. Basically I modified what this post lists as a solution: https://community.servicenow.com/community?id=community_question&sys_id=bae5cf21db1cdbc01dcaf3231f96194f
My automation script:

And my automated breakdown for task type using this script:

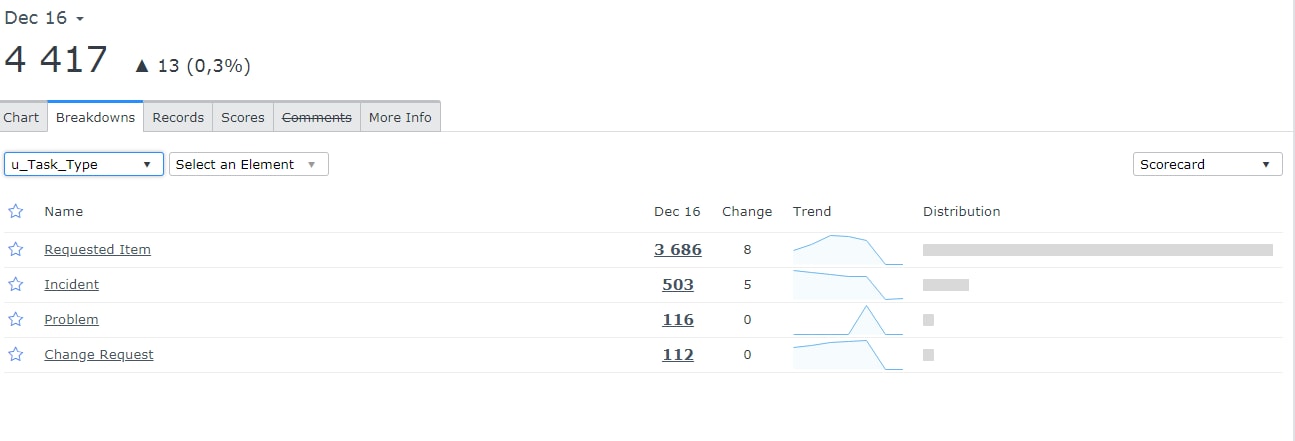
This seems to work just fine, as you can see below, the indicator has scores for both breakdowns.
Reassignment count scores:

And scores for task type breakdown:

Now finally I want to show these in a pivot heatmap, so I made a widget using these settings:

But when I view it in a dashboard it just shows no data:

What could be causing this? I've tried, and succeeded, in displaying funtioning breakdown scorecard widgets for both breakdowns, so the data is there. I'm not using real time scores, I made sure it's collecting the breakdown matrix and the collection job showed no errors.
The only thing I could think of was that the heatmap shows more than 1000 cells since the breakdown includes all object in sys_db_object, but that shouldnt be the case since the only stored breakdowns are incident, change request, requested item and problem. Right?
Solved! Go to Solution.
- Labels:
-
Reporting
- Mark as New
- Bookmark
- Subscribe
- Mute
- Subscribe to RSS Feed
- Permalink
- Report Inappropriate Content
12-17-2018 10:28 AM
Rubber duck method, I answered my own question.
The problem was that even though the indicator wasn't saving scores for each possible element in the breakdown source, they were all included in the heatmap. So the numer of cells was over 1000. By limiting the element in the breakdown source (sys_db_object) I managed to get it working.
Annoying that the error given when the cell count is too high is "no data to display" when the problem is in fact that there is too much data to display.
- Mark as New
- Bookmark
- Subscribe
- Mute
- Subscribe to RSS Feed
- Permalink
- Report Inappropriate Content
06-06-2019 08:54 AM
I have limited breakdown elements , even still data not showing in Pivot dashboards
breakdown 1 = 8 values
breakdown 2 = 7 values
can you please advice on this