Performance Analytics YTD List by Month Dashboard Widget
- Mark as New
- Bookmark
- Subscribe
- Mute
- Subscribe to RSS Feed
- Permalink
- Report Inappropriate Content
07-12-2022 02:38 AM
I have a requirement to create a dashboard that shows overall YTD performance along with a monthly breakdown.
Creating scores, whether it's YTD, Monthly, Quarter as a single aggregation is simple.
Creating a List Scorecard with multiple indicators set to 'by Month Sum' is also straight forward and I have the ability to choose to show multiple scores and control to select the number of periods that I want to display.
However, the number of periods to display needs to be variable depending on what month I'm in. If I'm currently in July, then I want it to only show the last 6 months, but if I'm in December then I want it to show 11 months.
It feels that there should be an additional parameter in the configuration for time series, that also allows you to choose a specific date range when choosing past periods.
Aside from creating a monthly indicator that removes scores from the results if not in the current YTD and always choosing a 12 month period (so not to get last years results in the mix), is there another solution that I may be missing?
How does everyone else deal with these types of requirements around YTD so that your breakdowns don't include data beyond this year?
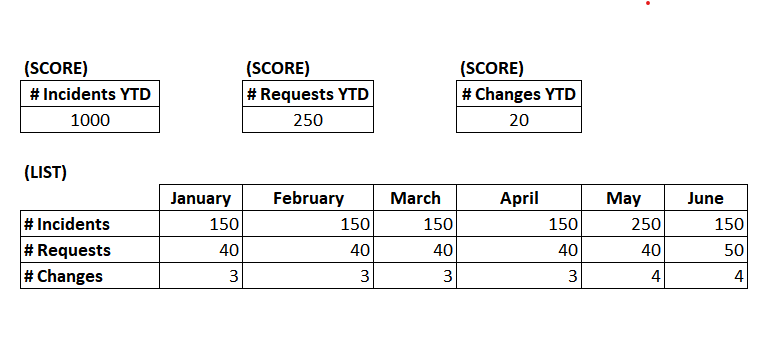
Oversimplified example of what I'm trying to achieve:

- Labels:
-
Performance Analytics
- Mark as New
- Bookmark
- Subscribe
- Mute
- Subscribe to RSS Feed
- Permalink
- Report Inappropriate Content
07-13-2022 08:41 AM
I agree this is a pain point, it would be good if on the widget you could select 'show current year/FY only' or similar.
Until that day, this is what we do:

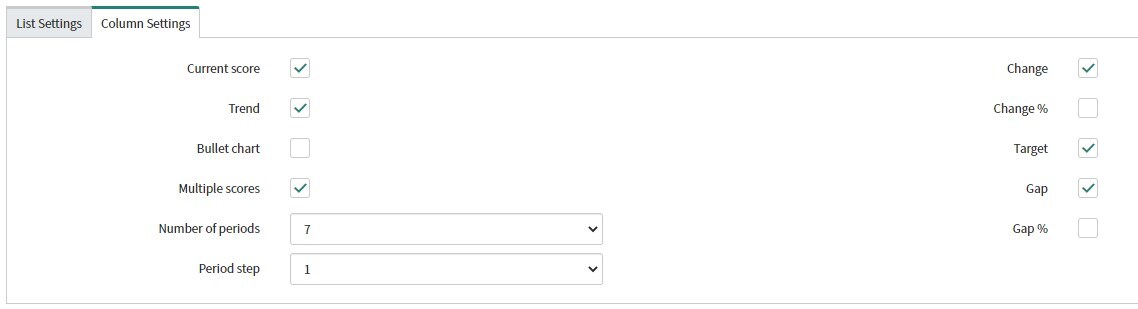
We create a Scorecard list PA Widget displaying an indicator group of Month Sum indicators (New Changes, Problems, Incidents in your example).
We then change the column settings to include X periods (based on current month), with 1 period step.
Each end of month as part of our regular reporting actions we go and move on this number (so in January, 1 period, 1 period step. Feb 2 periods, 1 period step, March 3 Periods, 1 period step, etc).
Its annoying as its simple to do and completely manual so is a prime candidate to automate....
We are fine with showing previous scores when someone clicks through to the analytics hub as this is usually done so that they can assess trends etc going back over a longer period of time, But this way the widget will only show the current year.
Hopefully this helps and I hope ServiceNow look at this in future.
If you feel this has helped, please mark this as correct to help others! 😃