Platform Analytics dashboard and its Interactivity
- Mark as New
- Bookmark
- Subscribe
- Mute
- Subscribe to RSS Feed
- Permalink
- Report Inappropriate Content
01-22-2025 11:58 PM - edited 01-23-2025 12:01 AM
Hi Everyone,
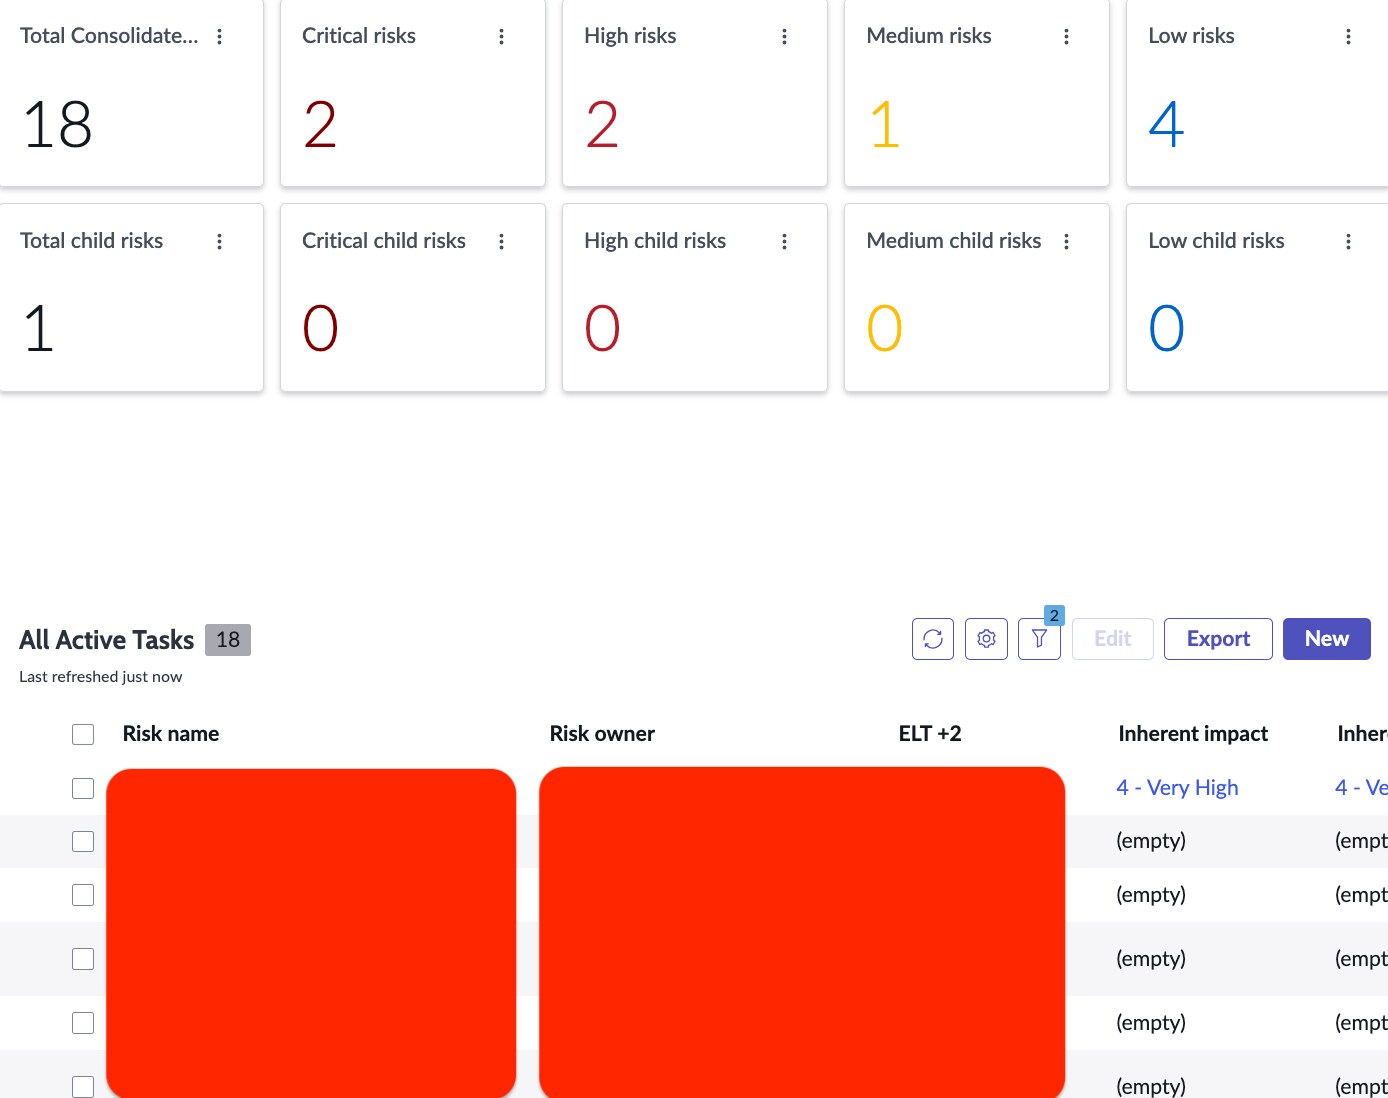
I’ve designed a dashboard in Platform Analytics and would like to make the single score reports interactive by linking them to list-type reports. Is there a way to achieve this functionality?
Additionally, I’ve built a list component report on the risk table and would like to display child risks when a user clicks on a parent risk. Essentially, I’m looking to show the parent-child relationship within the report.
- When a user clicks on any of the single score reports, the list-type visualization below should dynamically update to display the matching records from the sn_risk_risk table.
- For the list-type visualization component displaying parent risks, I would like to enable functionality where, if a user opens a parent risk, they can view the associated child risks, effectively showcasing the parent-child relationship.
Your guidance or suggestions on implementing these functionalities would be greatly appreciated.
Thank you!
- Mark as New
- Bookmark
- Subscribe
- Mute
- Subscribe to RSS Feed
- Permalink
- Report Inappropriate Content
01-23-2025 03:46 AM
Look into chart-to-chart interactions under https://www.servicenow.com/docs/bundle/xanadu-now-intelligence/page/use/par-for-workspace/concept/dv... but I don't think they will do everything you want.