- Mark as New
- Bookmark
- Subscribe
- Mute
- Subscribe to RSS Feed
- Permalink
- Report Inappropriate Content
05-30-2020 04:21 AM
Hi there,
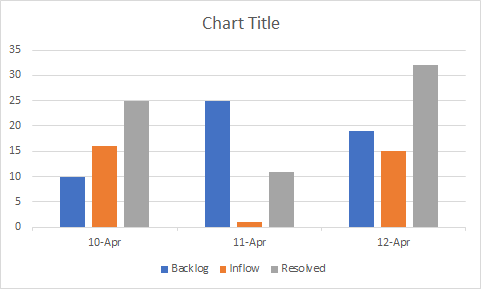
Every start of the day(say at 00:00 EST), I would like to show the backlog count at that point, inflow and the resolved incidents count in a bar chart as shown below. (Please note that I have the filters for each 3 of them ie backlog, inflow, resolved count filters) Could you please advise the steps to do this. I tried with Performance analytics as well as Trend chart report but couldn't do exactly as below. Your help is highly appreciated.

Solved! Go to Solution.
- Mark as New
- Bookmark
- Subscribe
- Mute
- Subscribe to RSS Feed
- Permalink
- Report Inappropriate Content
05-31-2020 02:18 PM
Hello,
As long as all three have the same day for the Created On, you could use additional Datasets to accomplish this. Here is a ServiceNow Doc that talks about it.
Here is a Community Blog that has a recent Office Hours that talks through also.
https://community.servicenow.com/community?id=community_blog&sys_id=5a3e245edb750490feb1a851ca961980
- Mark as New
- Bookmark
- Subscribe
- Mute
- Subscribe to RSS Feed
- Permalink
- Report Inappropriate Content
06-01-2020 05:12 AM
Thanks Thomas, that really helped.
I have one more question, I want to report the count of a filter every start of the day(for ex. the backlog count at start of every day). I should have today's date on x-axis and count on y-axis. Is there any way I can display the today's date on x-axis as shown below. Appreciate your help.

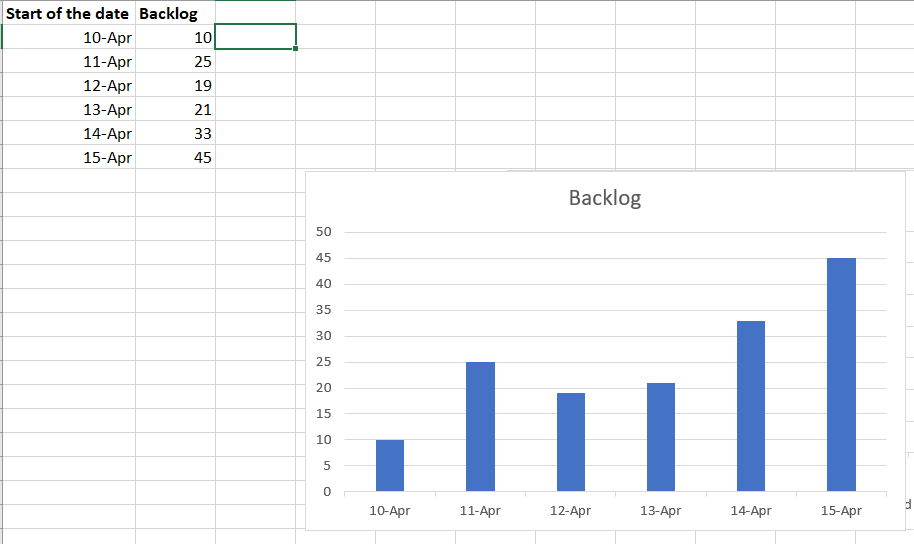
- Mark as New
- Bookmark
- Subscribe
- Mute
- Subscribe to RSS Feed
- Permalink
- Report Inappropriate Content
06-01-2020 05:40 AM
How many days of data are you trying to see on the report? Are you looking for everything that was created this month by day? Or something else?
- Mark as New
- Bookmark
- Subscribe
- Mute
- Subscribe to RSS Feed
- Permalink
- Report Inappropriate Content
06-01-2020 08:20 AM
Trying to show 1 month data in the report.
I'm looking to show the count of total number of tickets which are in open state at the start of the day.
(My filter for open state is : Assignment group=XYZ and state is not resolved and state is not closed)