- Mark as New
- Bookmark
- Subscribe
- Mute
- Subscribe to RSS Feed
- Permalink
- Report Inappropriate Content
05-30-2020 04:21 AM
Hi there,
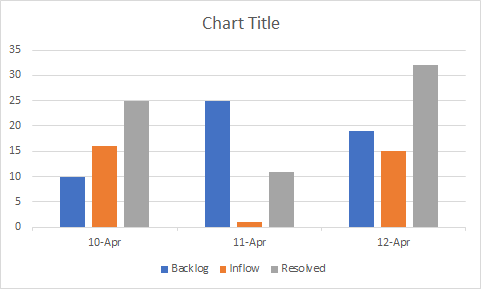
Every start of the day(say at 00:00 EST), I would like to show the backlog count at that point, inflow and the resolved incidents count in a bar chart as shown below. (Please note that I have the filters for each 3 of them ie backlog, inflow, resolved count filters) Could you please advise the steps to do this. I tried with Performance analytics as well as Trend chart report but couldn't do exactly as below. Your help is highly appreciated.

Solved! Go to Solution.
- Mark as New
- Bookmark
- Subscribe
- Mute
- Subscribe to RSS Feed
- Permalink
- Report Inappropriate Content
05-31-2020 02:18 PM
Hello,
As long as all three have the same day for the Created On, you could use additional Datasets to accomplish this. Here is a ServiceNow Doc that talks about it.
Here is a Community Blog that has a recent Office Hours that talks through also.
https://community.servicenow.com/community?id=community_blog&sys_id=5a3e245edb750490feb1a851ca961980
- Mark as New
- Bookmark
- Subscribe
- Mute
- Subscribe to RSS Feed
- Permalink
- Report Inappropriate Content
07-13-2023 05:33 AM
Can this be accomplished without performance analytics?
- Mark as New
- Bookmark
- Subscribe
- Mute
- Subscribe to RSS Feed
- Permalink
- Report Inappropriate Content
06-01-2020 08:41 AM
Do you have Performance Analytics?
- Mark as New
- Bookmark
- Subscribe
- Mute
- Subscribe to RSS Feed
- Permalink
- Report Inappropriate Content
06-01-2020 09:12 AM
Yes, I do have Performance Analytics.
- Mark as New
- Bookmark
- Subscribe
- Mute
- Subscribe to RSS Feed
- Permalink
- Report Inappropriate Content
06-01-2020 10:19 AM
Maybe take a look at doing a Relative Compare Widget:
https://docs.servicenow.com/bundle/orlando-performance-analytics-and-reporting/page/use/performance-...
Or Indicator Groups may work for what you are trying to accomplish as well:
https://docs.servicenow.com/bundle/orlando-performance-analytics-and-reporting/page/use/performance-...