Report to pull the active incidents every week
- Mark as New
- Bookmark
- Subscribe
- Mute
- Subscribe to RSS Feed
- Permalink
- Report Inappropriate Content
07-25-2018 03:35 AM
Hi All,
I would like to pull a report that shows active incidents every week.
Example: If a ticket is opened on 10th july it should display in the report and the same ticket should not be visible if it is closed by the next week in my weeky report. That being said the report should display every week's active incidents only.
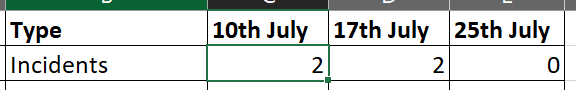
If the ticket is active on 10th july it might be closed by 25th july. So the bar chart should display something like below


Please help on adding the conditions to achieve like above.
- Labels:
-
Reporting
- Mark as New
- Bookmark
- Subscribe
- Mute
- Subscribe to RSS Feed
- Permalink
- Report Inappropriate Content
07-25-2018 04:45 AM
I guess, you need to try Active is "True" field in the Incident Table. Make sure, you check what all state values fall under Active is True condition. Create a column chart from this table and trend on opened date. You should get what you trying to achieve. Let me know if I got your que. right.
- Mark as New
- Bookmark
- Subscribe
- Mute
- Subscribe to RSS Feed
- Permalink
- Report Inappropriate Content
07-25-2018 06:19 AM
Hi
I should see a weekly bar chart like i showed earlier. and it should show the tickets created on that specific week.
If I use the conditions which you have mentioned am getting only the current active tickets
but I should get every weeks active tickets.
Example: if there are 4 tickets created on 10th jul and 7 ticket created on 17th jul and 2 tickets from 10th jul got closed by 17th jul then the ouput should be like 10th jul - 4 ticket and 17th jul - 9 tickets
- Mark as New
- Bookmark
- Subscribe
- Mute
- Subscribe to RSS Feed
- Permalink
- Report Inappropriate Content
07-25-2018 04:57 AM

- Mark as New
- Bookmark
- Subscribe
- Mute
- Subscribe to RSS Feed
- Permalink
- Report Inappropriate Content
07-25-2018 09:37 AM
If you want to see this historically over time, you'll want to look at Performance Analytics. I believe this KPI comes OOTB with the complimentary version of Performance Analytics for Incident.