- Mark as New
- Bookmark
- Subscribe
- Mute
- Subscribe to RSS Feed
- Permalink
- Report Inappropriate Content
09-08-2022 04:13 AM
Hello,
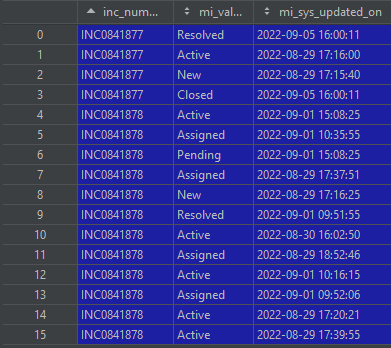
I want to see all the states a Service Request had in his lifetime and the date and time the state was updated. I did it already for incidents with the Inicdent Metric table, but i can not find a table that shows these Data for service request tickets (RITM Tickets). Shown below is a extract of how I get the Data from the Incident Metric Table:

Solved! Go to Solution.
- Labels:
-
Performance Analytics
-
Reporting
- Mark as New
- Bookmark
- Subscribe
- Mute
- Subscribe to RSS Feed
- Permalink
- Report Inappropriate Content
09-08-2022 07:44 AM
You should just need to create a new Metric Definition for the Requested Item table:
Try something like this:

Since you're just doing a Field Value Duration, you don't need a script... the script field is for more complicated checks and calculations and doesn't get observed for Field value duration types.
Since the "metrics events" business rule is on the Task table, and sc_req_item extends task, you shouldn't need to do anything else. If you wanted to do this on a new custom table, or a table that DOESN'T extend task, then you would just need to make a copy of the "metrics events" business rule that runs on the desired table.
Also, it may be worth noting. The incident_metric table you mentioned above is actually a database view of the metric_definition table (tells what measurements to collect) metric_instance table (the measurements themselves), and incident (so you can report and have access to all the fields on incident instead of specifically just the measurement). So if you're just trying to pull specific data about the state and time as in your table, incident_metric may be giving you a lot extra info you don't need. Likewise, it may muddy the waters a bit, because sys_updated_on is referring to the record itself... look for a field called "mi_start" or "mi_end" (in the database view... the mi_ prefix means it comes from metric instance table... if you're reporting directly off metric_instance, it'll just be "start" and "end") and it will give you the start and end times for that value of the field. Updated On may be the last updated date of the incident (whether or not that value changed) the metric definition (when it was last modified), or the most recent update of the metric_instance (which should at least correspond to "end" within a few milliseconds)
The upshot of that is that the new Metric you created, once activated will write to the metric_instance table as well, not incident_metric. But you can create a database view for sc_req_item_metric if one doesn't already exist, by looking at the incident_metric table and modifying accordingly.
- Mark as New
- Bookmark
- Subscribe
- Mute
- Subscribe to RSS Feed
- Permalink
- Report Inappropriate Content
09-08-2022 07:44 AM
You should just need to create a new Metric Definition for the Requested Item table:
Try something like this:
Since you're just doing a Field Value Duration, you don't need a script... the script field is for more complicated checks and calculations and doesn't get observed for Field value duration types.
Since the "metrics events" business rule is on the Task table, and sc_req_item extends task, you shouldn't need to do anything else. If you wanted to do this on a new custom table, or a table that DOESN'T extend task, then you would just need to make a copy of the "metrics events" business rule that runs on the desired table.
Also, it may be worth noting. The incident_metric table you mentioned above is actually a database view of the metric_definition table (tells what measurements to collect) metric_instance table (the measurements themselves), and incident (so you can report and have access to all the fields on incident instead of specifically just the measurement). So if you're just trying to pull specific data about the state and time as in your table, incident_metric may be giving you a lot extra info you don't need. Likewise, it may muddy the waters a bit, because sys_updated_on is referring to the record itself... look for a field called "mi_start" or "mi_end" (in the database view... the mi_ prefix means it comes from metric instance table... if you're reporting directly off metric_instance, it'll just be "start" and "end") and it will give you the start and end times for that value of the field. Updated On may be the last updated date of the incident (whether or not that value changed) the metric definition (when it was last modified), or the most recent update of the metric_instance (which should at least correspond to "end" within a few milliseconds)
The upshot of that is that the new Metric you created, once activated will write to the metric_instance table as well, not incident_metric. But you can create a database view for sc_req_item_metric if one doesn't already exist, by looking at the incident_metric table and modifying accordingly.