Track number of active open tickets waiting
- Mark as New
- Bookmark
- Subscribe
- Mute
- Subscribe to RSS Feed
- Permalink
- Report Inappropriate Content
08-30-2022 10:02 AM
My supervisor needs me to create a report that would show the number of active, open, unassigned tickets of a specific type (which I can filter) per week. We are a small department and trying to justify hiring more help with this task and need to show the number of tickets growing. However, anytime I start a report, I'm required to choose a trend activity and there is no way just to choose "active" or "none." Any trend activity will limit the results because nothing is happening with those tickets.
I just want it to count the number of active unassigned each week over a period of time. Is this an option?
I chose multiple for version because we're currently on Quebec and are moving to San Diego.
As I understand we have a limited analytics package and I don't know much about it. Any help?
- Labels:
-
Multiple Versions
-
Reporting
- Mark as New
- Bookmark
- Subscribe
- Mute
- Subscribe to RSS Feed
- Permalink
- Report Inappropriate Content
08-31-2022 12:54 PM
Hey Jason,
Go to Reports > Create New. You should be able to select the Incident table for your data source. Create a Time Series Column report under Type. Under Configure set Group by to Created, set Trend by to Created, the select Week under the Calendar section.
Set your filter on the report to:
Active is True
Assigned to is empty
State is one of New, In Progress, On Hold
Created "whatever your time frame is"
This will give you by the week for whatever data you need.
Once you place it on a Dashboard, you can use the Incident Opened out of the box Interactive Filter.
Create a report visualization
Add an interactive filter widget to a responsive dashboard
I hope this helps and guides you,
- Mark as New
- Bookmark
- Subscribe
- Mute
- Subscribe to RSS Feed
- Permalink
- Report Inappropriate Content
09-01-2022 04:53 AM
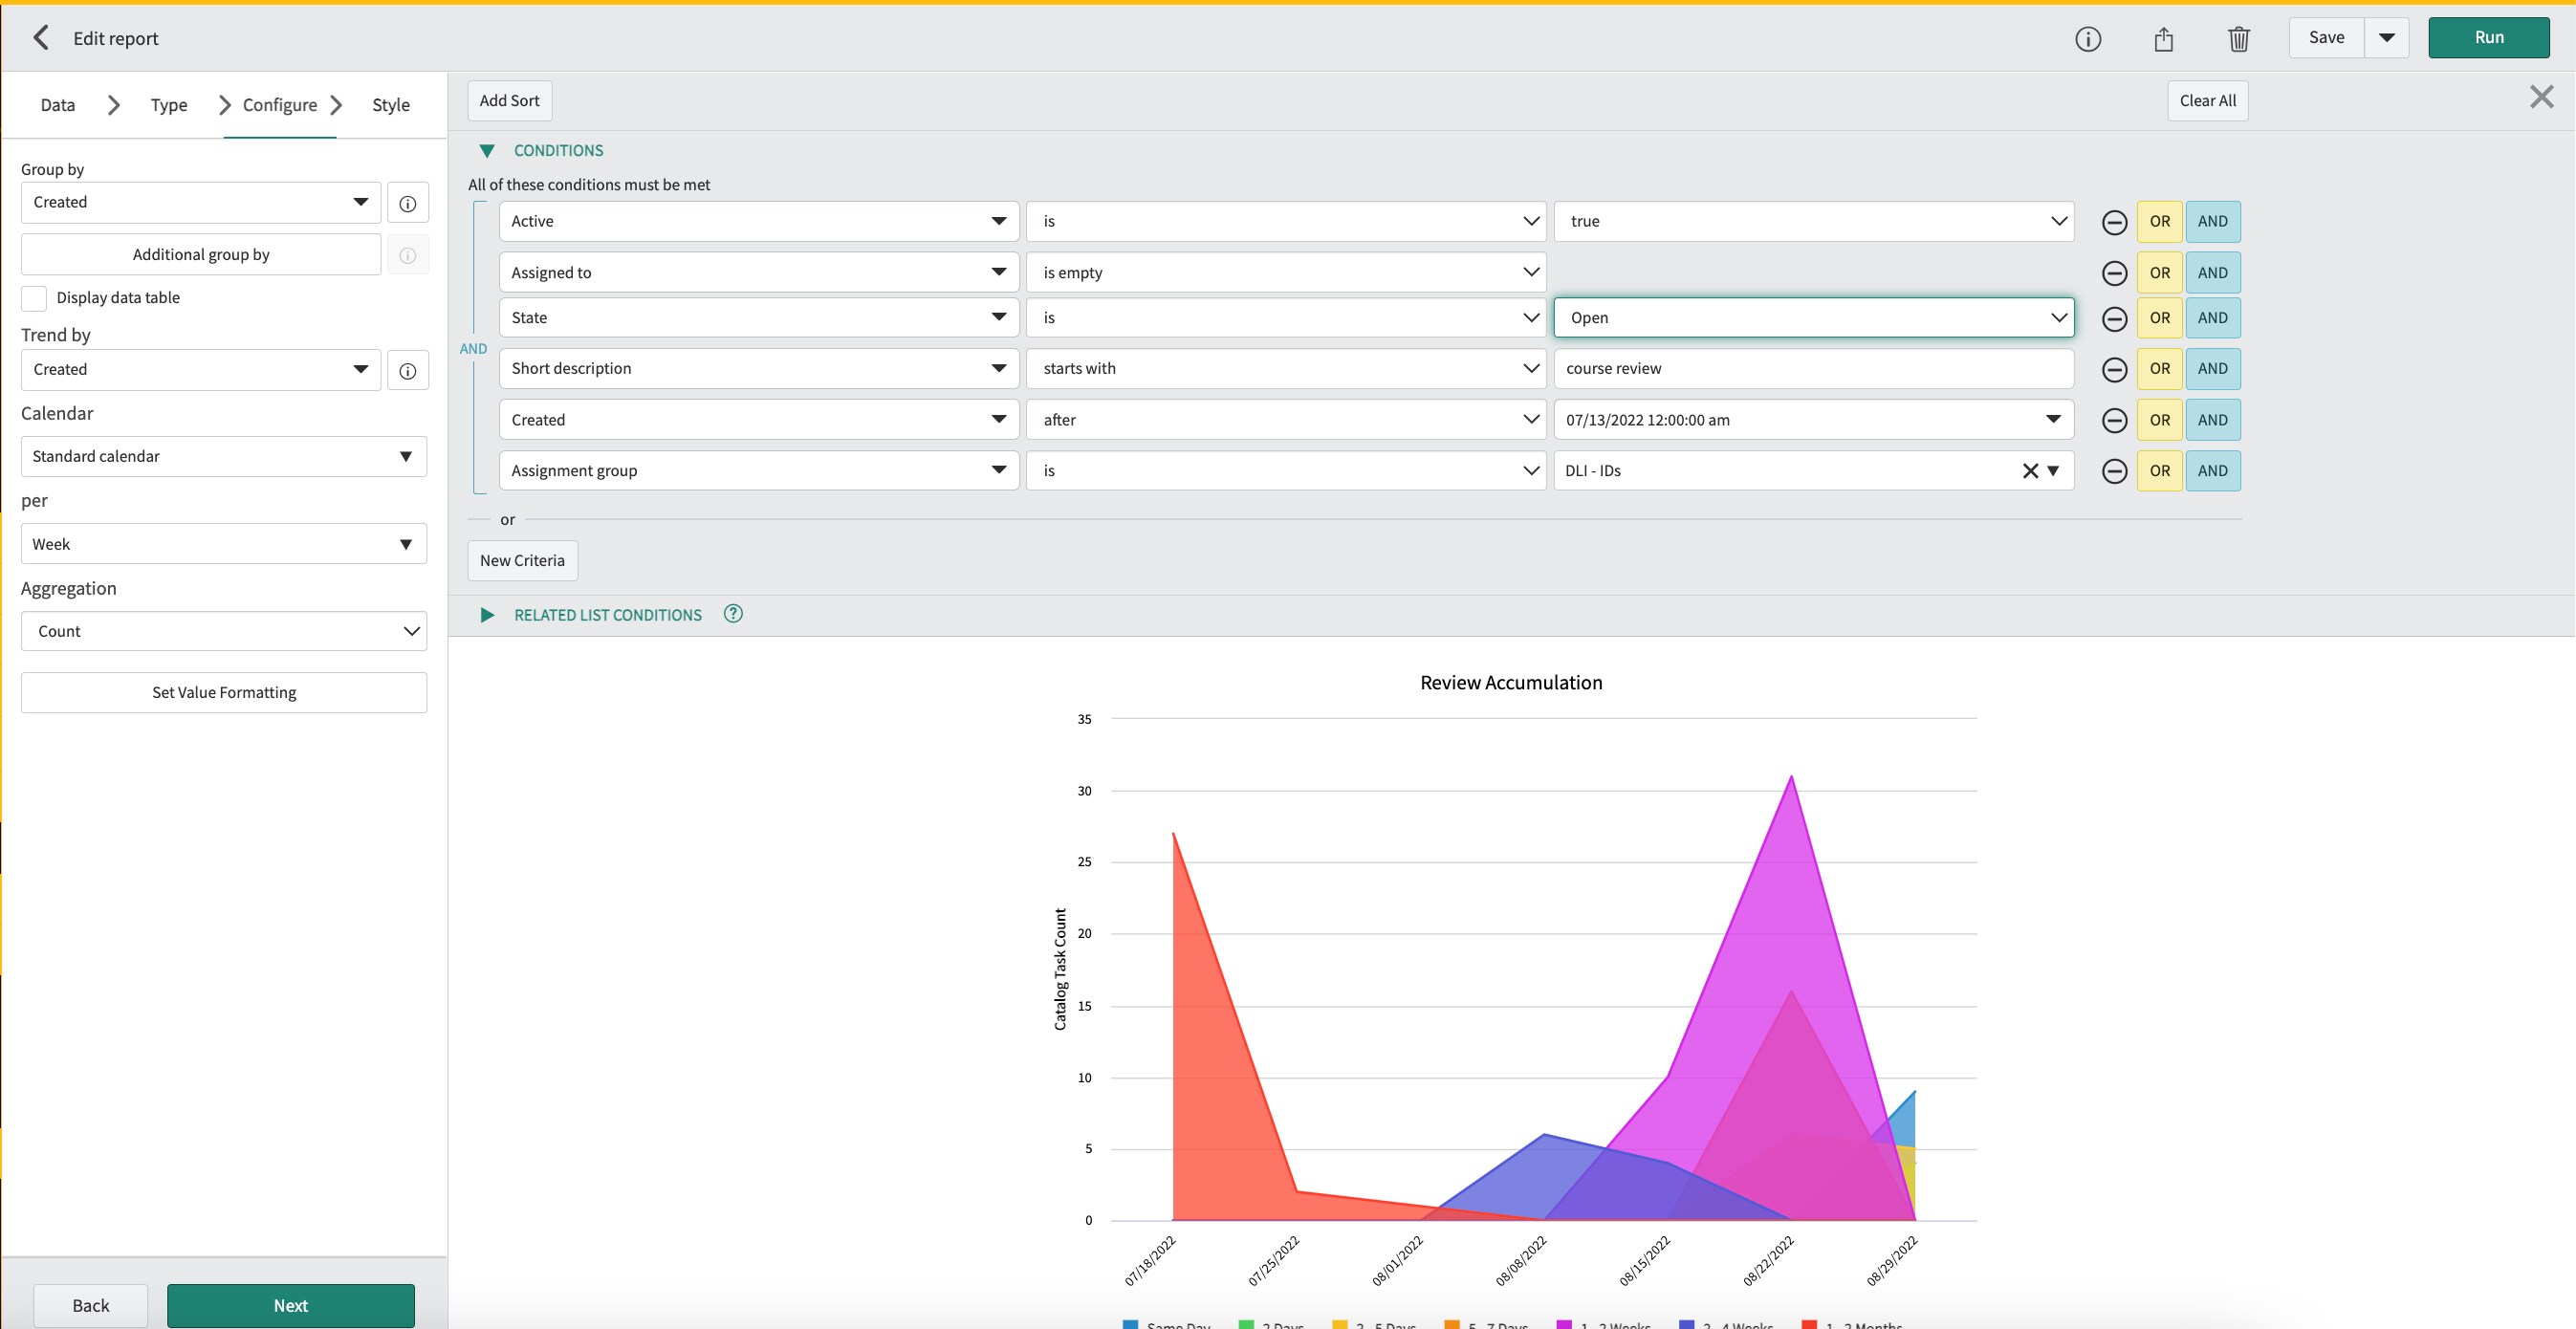
Unfortunately, no, that isn't getting me what I need. I'm including a screen shot.
These particular tickets aren't getting handled, they're just waiting. So I've set the state to open. This report shows me spikes, when the tickets were created. I want the number to grow as they are created and not taken. In other words, I don't want it to tell me how many were created on 7/18 and 7/25, but to count how many were still open on those days as more were added.
I've added a second image as well. The result I'm looking for should look less like the spiky image and more like the one that shows growth.
- Mark as New
- Bookmark
- Subscribe
- Mute
- Subscribe to RSS Feed
- Permalink
- Report Inappropriate Content
09-01-2022 04:59 AM
- Mark as New
- Bookmark
- Subscribe
- Mute
- Subscribe to RSS Feed
- Permalink
- Report Inappropriate Content
04-15-2023 02:51 AM - edited 03-01-2024 02:32 AM
It sounds like you are trying to create a report that shows the number of active, open, unassigned tickets of a specific type per week. However, you are running into an issue with the trend activity selection in the analytics package you are using.
One possible solution is to filter the report by the specific type of ticket you are interested in, and then select a trend activity that does not affect the results. For example, you could select a trend activity like "Ticket Created Date" or "Ticket Resolved Date", which should not impact the active tracking number, open, unassigned tickets you are trying to count.
Alternatively, you could create a custom metric in the analytics package that simply counts the number of active, open, unassigned tickets of the specific type you are interested in, and then group the results by week. This would give you the exact count you are looking for without any trend activity.
If you are not familiar with creating custom metrics or reports in your analytics package, it may be helpful to reach out to the support team or consult the documentation for guidance. Additionally, if your current analytics package does not provide the functionality you need, you may want to consider exploring other options that better suit your reporting requirements.