


lisa slavin

ServiceNow Employee
Options
- Subscribe to RSS Feed
- Mark as New
- Mark as Read
- Bookmark
- Subscribe
- Printer Friendly Page
- Report Inappropriate Content
08-20-2014
12:33 PM
As a ServiceNow technical trainer, I commonly house training videos, learning interactions, job aids and other reference materials in knowledge articles because it is a centralized repository that all my learners can access. Plus if I were to make any modification to the content I can be sure everyone is viewing the most updated version.
As you can imagine, it is very important that my learners are reviewing these articles for educational purposes. However, I only communicate to my audience that the article exists and there is an expectation for them to view it. The user is responsible for actually visiting the article.
To collect metrics on who opens a knowledge article, I run two reports:
- A list report on which users view a specific knowledge article, grouped by department
- A trend report on department views each month
I choose to group the data by department so I can:
- Share these metrics with the department managers so they know which of their direct reports are/are not viewing the training content.
- Learn which departments are opening the article most often (I then make an educated guess as to why that is).
List Report
This list report tells me that over the course of X months:
- The users who did open the article and the date they did so.
- Groups the users by their department name. Note that a new record is created each time the user visits the article, therefore if the user opens the article several times, multiple records will be created for that user.
- Total knowledge views.
The final report looks like this:
Directions
- Reports > Create New
- Name: Choose a friendly name that describes what the report is about
- Type: List
- Table: kb_use
- Grouped by: Department
- Visible to: You can indicate groups or users who can also view your report
- Click the Add Filter Conditions button
- Add the following filters:
- Article | is | < KB number >
- Optional filter: User.Department | is not | <your team name>
I choose to use this filter to remove any outlier records. For example, I remove my department because my team commonly reviews my articles for content accuracy, not for learning purposes. - Optional filter: Created | on | <choose date option>
I choose to use this filter to narrow down the parameters of when the article was viewed.
Trend report
This trend report tells me that over the course of X months:
- How many views the article receives each month.
- Each month, what percent of views are from which departments.
- How many users in each department viewed the article.
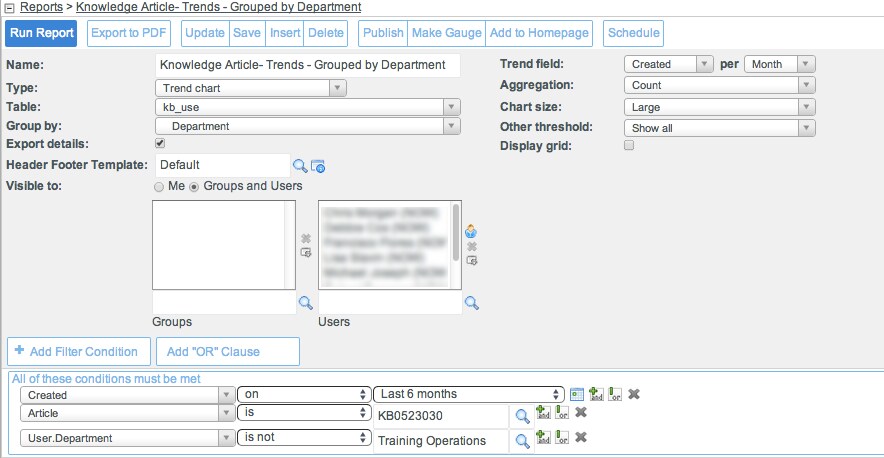
The final report looks like this:
Directions
- Reports > Create New
- Name: Choose a friendly name that describes what the report is about
- Type: Trend chart
- Table: kb_use
- Grouped by: Department
- Visible to: You can indicate groups or users who can also view your report
- Trend field: Created per Month
- Aggregation: Count
- Click the Add Filter Conditions button
- Add the following filters:
- Article | is | < KB number >
- Optional filter: User.Department | is not | <your team name>
I choose to use this filter to remove any outlier records. For example, I remove my department because my team commonly reviews my articles for content accuracy, not for learning purposes. - Optional filter: Created | on | <choose date option>
I choose to use this filter to narrow down the parameters of when the article was viewed.
I welcome your feedback and comments and would love to learn how you measure knowledge article views.
Labels:
- 37,170 Views
15 Comments
- « Previous
-
- 1
- 2
- Next »
You must be a registered user to add a comment. If you've already registered, sign in. Otherwise, register and sign in.
