Incidents Report With Both Resolved and Created
- Mark as New
- Bookmark
- Subscribe
- Mute
- Subscribe to RSS Feed
- Permalink
- Report Inappropriate Content
01-22-2018 07:57 AM
Hi,
Using performance analytics is it possible to create a report of incidents consisting of incidents created/resolved?
Get started with Performance Analytics for Incident Management
- Mark as New
- Bookmark
- Subscribe
- Mute
- Subscribe to RSS Feed
- Permalink
- Report Inappropriate Content
01-22-2018 08:16 AM
Hey Swathi,
You can have Pie chart like below:

Hope this will helps you and let me know if you need more help.
Thanks,
Rajashekhar Mushke
Rising star : 2022 - 2024
Community Leader -2018
Connect me on LinkedIn : Rajashekhar Mushke
- Mark as New
- Bookmark
- Subscribe
- Mute
- Subscribe to RSS Feed
- Permalink
- Report Inappropriate Content
01-23-2018 11:31 AM
Any update on this?
let me know if you need more help.
Let me know if that answered your question. If so, please mark the response as correct so that others with the same question in the future can find it quickly and that it gets removed from the Unanswered list. Thank you
How To Mark Answers Correct From Community Inbox
Thanks,
Rajashekhar Mushke
Rising star : 2022 - 2024
Community Leader -2018
Connect me on LinkedIn : Rajashekhar Mushke
- Mark as New
- Bookmark
- Subscribe
- Mute
- Subscribe to RSS Feed
- Permalink
- Report Inappropriate Content
01-24-2018 03:15 AM
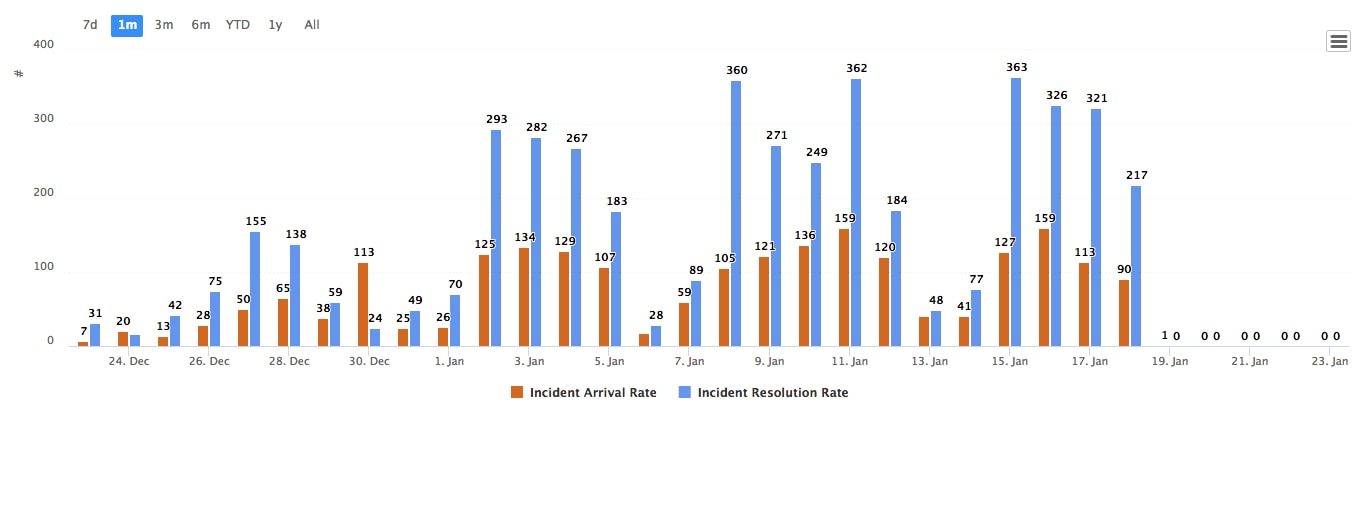
HI Swathi, Yes you can use PA for creating these metrics. You need to define two indicators with daily frequency, one indicator for collecting incidents created on that day, and another indicator for collecting incidents resolved on that day. Then you have to create a widget of type time series where in you can add these two indicators for created and Resolved in that widget and it shows the two trend lines over a period if you collect the historic data. So when you want to see for a particulat week or day how many incidents created and resolved the widget clearly shows you the trend lines.Something like below chart.

- Mark as New
- Bookmark
- Subscribe
- Mute
- Subscribe to RSS Feed
- Permalink
- Report Inappropriate Content
01-25-2018 04:45 AM
I need exactly same report as shown by you. Thanks Padmanabam for responding to my question. Can you please give me the step by step solution for implementing this solution?