- Mark as New
- Bookmark
- Subscribe
- Mute
- Subscribe to RSS Feed
- Permalink
- Report Inappropriate Content
12-17-2020 10:50 AM
Hello Team,
Like many of you, I am trying to work through how to utilize the CSDM in my environment. We are a shared services provider for several child company's all managed in a single environment. I'm trying to show leadership the real value of moving into more of a Services Oriented view of our world. One place where I feel like there is significant value is in our Network Services Monitoring Service. Allowing our network engineers to easily consolidate the view of alerts and incidents into a clear status view of the network Service at a specific Site. (We have over 900 sites world-wide.)
I would describe where we are as a solid crawl. We have discovery running on most of the network infrastructure and there are attributes on the CI's that we can use to group them by site using a filter. We also have monitoring tools deployed and generating alerts for network devices. I want my network engineers to have a view where they can see the status (Green, Yellow, Red) of all the sites and be able to drill into those services to see the Alerts, Incidents, etc driving the status.
After reading the CSDM 3.0 I envisioned having a Technical Service that would just be “Network” and build service offerings for each Location using dynamic CI Groups. When I started trying to implement this in practice, I found that when you use a dynamic CI Group, it creates a “Query Based Technical Service” but it doesn’t allow Service Offerings to be assigned to it natively. When I tried to create a Technical Service and a Technical Service Offering directly from the CSDM window, I can use the Relationship Builder to add the CI’s to the Service or Service Offering level but I’m wondering if that is really the best way to do that.
Does anyone have an example of how they have modeled Network Support of multiple sites in the Technical Service area of CSDM?
Solved! Go to Solution.
- Mark as New
- Bookmark
- Subscribe
- Mute
- Subscribe to RSS Feed
- Permalink
- Report Inappropriate Content
12-18-2020 02:27 PM
Hi
Looks like we live in the same city. More than happy to guide you.
First I would say as a CSDM advisor that I use the TBM Taxonomy to help define those higher level services, and yes Network Services is a good place to start.
Mapped out what you are asking for several clients.
I see this as your main ask " I want my network engineers to have a view where they can see the status (Green, Yellow, Red) of all the sites and be able to drill into those services to see the Alerts, Incidents, etc driving the status. "
To have a view where they can see the status I assume you are using Event Management, correct?
Start with this:
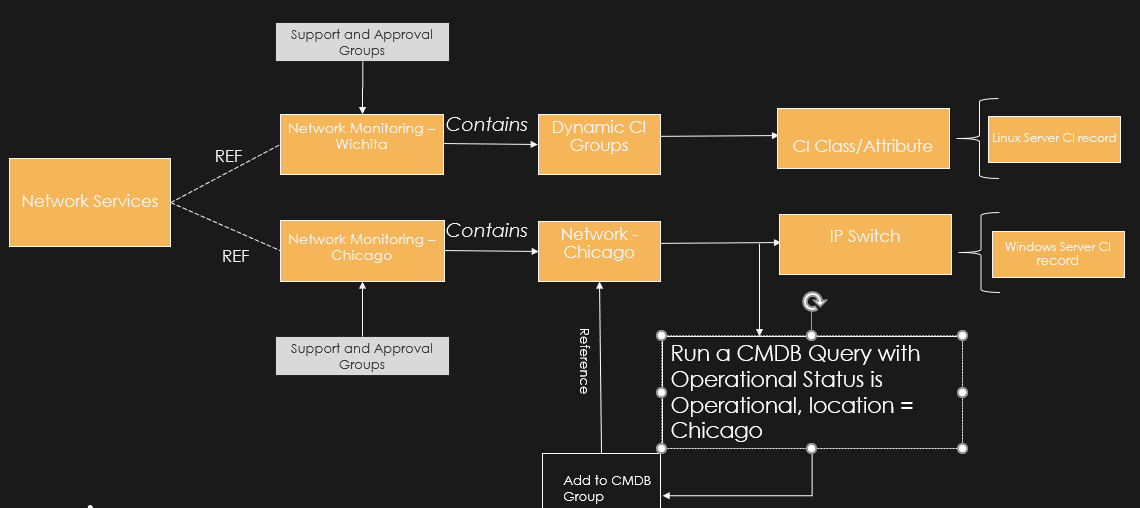
Technical Service - Network Services
Service Offering - Network Monitoring - Chicago - contains local support group
Service Offering - Network Monitoring - Wichita - contains local support group
Not every technical service has a an application service or a business service, these are "underpinning services." That is another discussion. Called out in a recent PEAK training for implementation partners.
Here is what you are missing, your almost there:
Create a CMDB Query using the CMDB Query builder. (This may take access)
Once you create a query, you will add it to a CMDB Group.
Then you can attach the CMDB group to the Dynamic CI class - This can ONLY be done in PARIS.
Lastly, you will create a "contains relationship" on the Network Monitoring - Location and add the Dynamic CI Group.
- Navigate to Configuration and click CMDB Query Builder.
- Click Create new. Enter a Name – Network - Wichita
- In the CMDB Classes list, locate for example the IP Switch class, and drag it to the canvas.
- Use the condition filter above the Windows box on the canvas.
Set the conditional filter to Operational Status is “Operational” and Location contains Wichita - Click Save, and then click Saved Queries on the left to see the widget for the saved query.
- Click the query widget to return to the canvas in edit mode.
- Click Run to execute the query.

Review the query results. Each row displays the name of a ip switch CI
You may run queries on multiple tables or a parent table like "Network Gear"
Add columns to the query results:
- Click the Switch node on the canvas once or twice so that the Server 1 Report Columns section appears in the right-side pane. Click Add Columns.
- Select Manufacturer and then click outside the columns list to close it.
- Click Run. Review the query results which now include the Manufacturer column.
- Click Save again to save all your customization for this query.
Reference ServiceNow Documentation for building other queries
Add Queries to a CMDB Group -
Navigate to CMDB Groups>New
Name the Group to be similar to the Dynamic Group and Offering (Network Gear - Location)
Submit
Add Query - The new query you just created
CMDB Groups can be added to a Dynamic Group
Navigate to Dynamic CI Group
Fill it out (yes support groups can be added here as well)
on the CMDB Group field - select your CMDB group that you just created.
In event management you can use this to display the "Red, Yellow, Green" on the dashboard.
Dynamic CI groups can also group together CIs that "make up an application service" and mapped to the Application Service in the Application Service wizard.

- Mark as New
- Bookmark
- Subscribe
- Mute
- Subscribe to RSS Feed
- Permalink
- Report Inappropriate Content
02-02-2021 01:54 PM
Hi Mary,
Here's my specific use case. I have an event that comes in. It raises an Alert. The alert references the CI. The CI is part of a dynamic CI group representing a Technical Service. Now I'm creating an Incident from the Alert using an Alert Management Rule that runs a subflow to create the Incident. I want the Incident to reflect the Technical Service and maybe set the Assignment group based on the Support Group for the Technical Service.
Am I on the right track?
How do I specifically get the last part to happen? Automatically setting the Tech Service and Support Group/Assignment Group in the Incident?
Best Regards,
Rick.
- Mark as New
- Bookmark
- Subscribe
- Mute
- Subscribe to RSS Feed
- Permalink
- Report Inappropriate Content
12-02-2021 07:28 PM
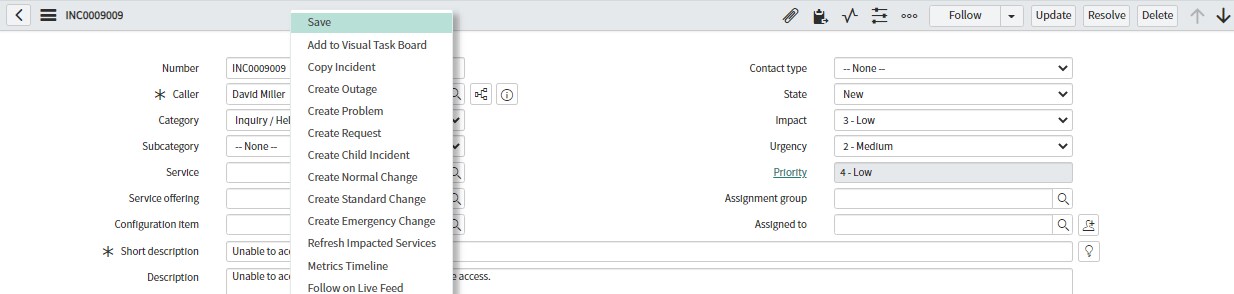
The incident form has a tab called "Impacted Service CIs". This tab can be populated by right clicking on the top banner where the incident number is displayed. Select "Refresh Impacted Services" to force a recalculation of the services impacted by the incident.

Warning: I have an open Hi Ticket concerning lack of proper propagation for Dynamic CI groups that use the original filter and table population method. They broke the propagation function for Change and Incident when adding new population methods (CMDB Group and Query Builder). I've been told it works for the new population methods.
- Mark as New
- Bookmark
- Subscribe
- Mute
- Subscribe to RSS Feed
- Permalink
- Report Inappropriate Content
01-28-2021 08:55 AM

- Mark as New
- Bookmark
- Subscribe
- Mute
- Subscribe to RSS Feed
- Permalink
- Report Inappropriate Content
12-02-2021 07:16 PM
This post shows you a few ways to see your CI list for a Dynamic CI group.
- From the list view (enter "cmdb_ci_query_based_service.LIST" in the left nav search area) for Dynamic CI Groups (see below) you should see a column called "View Service CIs" that contains a reference to the CI list for the Dynamic CI Group.
If you select the Service from the list view, it brings up the form(use Default View) for the Dynamic CI Group. 
The Associated CIs for all Application Service classes are stored in the Service Configuration Item Association[svc_ci_assoc] table so that's why they don't appear in the Dependency View (which only shows relationships). 


From that point forward, the list of CIs for the service will appear in the Service Configuration Items tab for the view.

3. If you're using the original version of the Dynamic CI Group implementation that uses a table and filter, the Green preview button can be used to see an updated CI list based on the last changes made to the Filter. Select Preview, then select the link that appears next to the Preview button.

4. From the Event Management Dashboard (included with event management) you can drill down the Service Groups Hoerarchy (use the Groups Button first) to the Dynamic CI Group you want.

