- Mark as New
- Bookmark
- Subscribe
- Mute
- Subscribe to RSS Feed
- Permalink
- Report Inappropriate Content
11-02-2018 02:19 AM
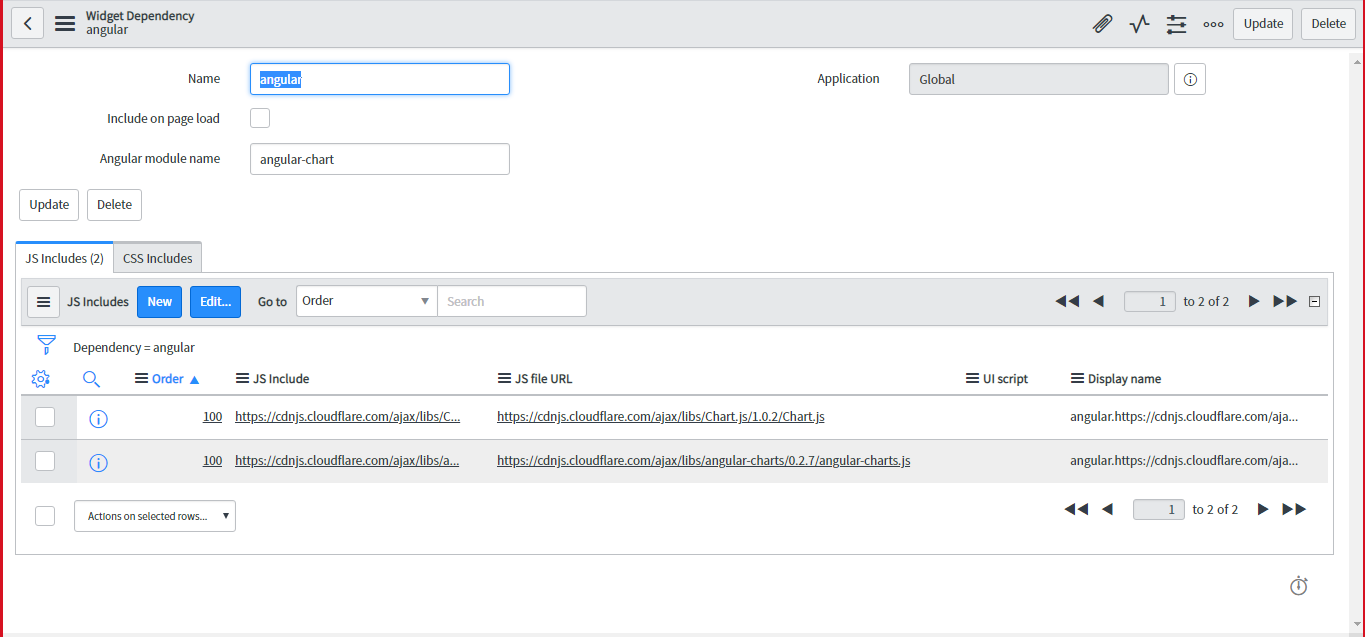
i have added the widget dependency for creating a Bar chart , but i am unable to get the output
Below i have mentioned the screen shots
HTML:

<div>
<!-- your widget template -->
   Test

   <canvas id="bar" class="chart chart-bar"


                   chart-data="data" chart-labels="c.labels" chart-series="c.series">

   </canvas>

</div>


Client script:


function($scope) {


var c = this;


c.lables = ['2006','2007','2008','2009','2010','2011','2012'];


c.series = ['Series A', 'Series B'];


c.data = [


[65, 59,80,81,56,55,40],


[28, 48,40,19,86,27,90]


];


}


Solved! Go to Solution.
- Mark as New
- Bookmark
- Subscribe
- Mute
- Subscribe to RSS Feed
- Permalink
- Report Inappropriate Content
11-15-2018 02:02 AM
i used the below code and it worked
and added ui script in dependency
Client script:

(function() {

  var category_count = {};


var  ga = new GlideAggregate('incident');
  ga.addAggregate('COUNT');
  ga.groupBy('category');
   ga.query();
  while (ga.next()) {
   var category_name = ga.category.getDisplayValue() + '' || '(empty)';
      count = ga.getAggregate('COUNT') * 1;
      category_count[category_name] = count;

  }


  data.categories = Object.keys(category_count);
  data.series = [{
      'name':'category count',
      'legendIndex': 0,
      'data': []
  }
];

 data.categories.forEach(function(it)
													{
     data.series[0].data.push(category_count[it]);

  });
})();

server script:

function() {

  var c = this;

    var chart1 = new Highcharts.Chart({
  chart: {
      renderTo: 'custom_report',
      type: 'column'
  },
  title: {
      text: null
  },
  xAxis: {
      categories: c.data.categories,
      title: {
          text: null
      },
      labels: {
          rotation: -45
      }
  },
  yAxis: {
      min: 0,
      title: {
          text: null
      }
  },
  series: c.data.series
 });
}

html:

<div>
<body>
<div id="custom_report">

</div>

</body>
</div>- Mark as New
- Bookmark
- Subscribe
- Mute
- Subscribe to RSS Feed
- Permalink
- Report Inappropriate Content
11-02-2018 04:23 AM
Are you referring any blog or documentation?
- Mark as New
- Bookmark
- Subscribe
- Mute
- Subscribe to RSS Feed
- Permalink
- Report Inappropriate Content
11-02-2018 04:34 AM
This is the link which i have referred can i know where he as gone wrong
- Mark as New
- Bookmark
- Subscribe
- Mute
- Subscribe to RSS Feed
- Permalink
- Report Inappropriate Content
11-02-2018 04:55 AM
According to that thread, they have included all external JS into HTML Template.
like
<script>https://code.angularjs.org/1.4.8/angular.js"></script>

<script>https://code.angularjs.org/1.4.8/angular-resource.js"></script>

<script>https://cdnjs.cloudflare.com/ajax/libs/Chart.js/1.0.2/Chart.js"></script>

<script>https://cdnjs.cloudflare.com/ajax/libs/angular-chart.js/0.10.2/angular-chart.js"></script>
Try to implement in this way.
Regards,
Chandra Prakash
- Mark as New
- Bookmark
- Subscribe
- Mute
- Subscribe to RSS Feed
- Permalink
- Report Inappropriate Content
11-02-2018 05:10 AM

- Mark as New
- Bookmark
- Subscribe
- Mute
- Subscribe to RSS Feed
- Permalink
- Report Inappropriate Content
11-15-2018 02:02 AM
i used the below code and it worked
and added ui script in dependency
Client script:

(function() {

  var category_count = {};


var  ga = new GlideAggregate('incident');
  ga.addAggregate('COUNT');
  ga.groupBy('category');
   ga.query();
  while (ga.next()) {
   var category_name = ga.category.getDisplayValue() + '' || '(empty)';
      count = ga.getAggregate('COUNT') * 1;
      category_count[category_name] = count;

  }


  data.categories = Object.keys(category_count);
  data.series = [{
      'name':'category count',
      'legendIndex': 0,
      'data': []
  }
];

 data.categories.forEach(function(it)
													{
     data.series[0].data.push(category_count[it]);

  });
})();

server script:

function() {

  var c = this;

    var chart1 = new Highcharts.Chart({
  chart: {
      renderTo: 'custom_report',
      type: 'column'
  },
  title: {
      text: null
  },
  xAxis: {
      categories: c.data.categories,
      title: {
          text: null
      },
      labels: {
          rotation: -45
      }
  },
  yAxis: {
      min: 0,
      title: {
          text: null
      }
  },
  series: c.data.series
 });
}

html:

<div>
<body>
<div id="custom_report">

</div>

</body>
</div>