- Mark as New
- Bookmark
- Subscribe
- Mute
- Subscribe to RSS Feed
- Permalink
- Report Inappropriate Content
12-14-2017 12:07 PM
Hi,
I have a fairly straight forward request to produce a report of all service catalog items and how many times each of those catalog items has been requested. I was expecting to find something OOTB but it doesn't appear to exist, there are very similar reports like top n requested items but not exactly what I'm after. In excel, SQL, crystal reports or even MS access this is a fairly trivial task, but I can't seem to replicate that in ServiceNow. Possibly there is some way with performance analytics, but I don't know enough about pa yet to know how to accomplish this.
The solution I have come up with is creating a left join database view with sc_cat_item and sc_req_item. Now this gives me the record set I require, all catalog items and the requested items related to them, even if there are none. I can group total the list on the item field, which gives me the total I want, except for those items that have no related requested items. The total for these rows will show as 1 instead of 0, because the total is counting the number of rows. I want the total to count the number of requested items.
I want to avoid using scripting and dynamic content where possible so that users can still adjust the filters, or drill down and export as necessary.
Regards,
Tim
Solved! Go to Solution.
- Labels:
-
Analytics and Reports
- Mark as New
- Bookmark
- Subscribe
- Mute
- Subscribe to RSS Feed
- Permalink
- Report Inappropriate Content
01-13-2021 07:38 PM
This question was asked long ago, but since the solution only covers how to measure Catalog Items that produce Requested Items (as opposed to other Task types), I thought I'd drop a link to an article on the subject I just wrote: Measuring Catalog Item Usage Comprehensively Across All Produced Tasks in Performance Analytics. Hopefully someone else who sees this thread will find it useful.
-Gray
- Mark as New
- Bookmark
- Subscribe
- Mute
- Subscribe to RSS Feed
- Permalink
- Report Inappropriate Content
12-14-2017 01:13 PM
Just giving you grief Tim.
- Mark as New
- Bookmark
- Subscribe
- Mute
- Subscribe to RSS Feed
- Permalink
- Report Inappropriate Content
12-14-2017 12:32 PM
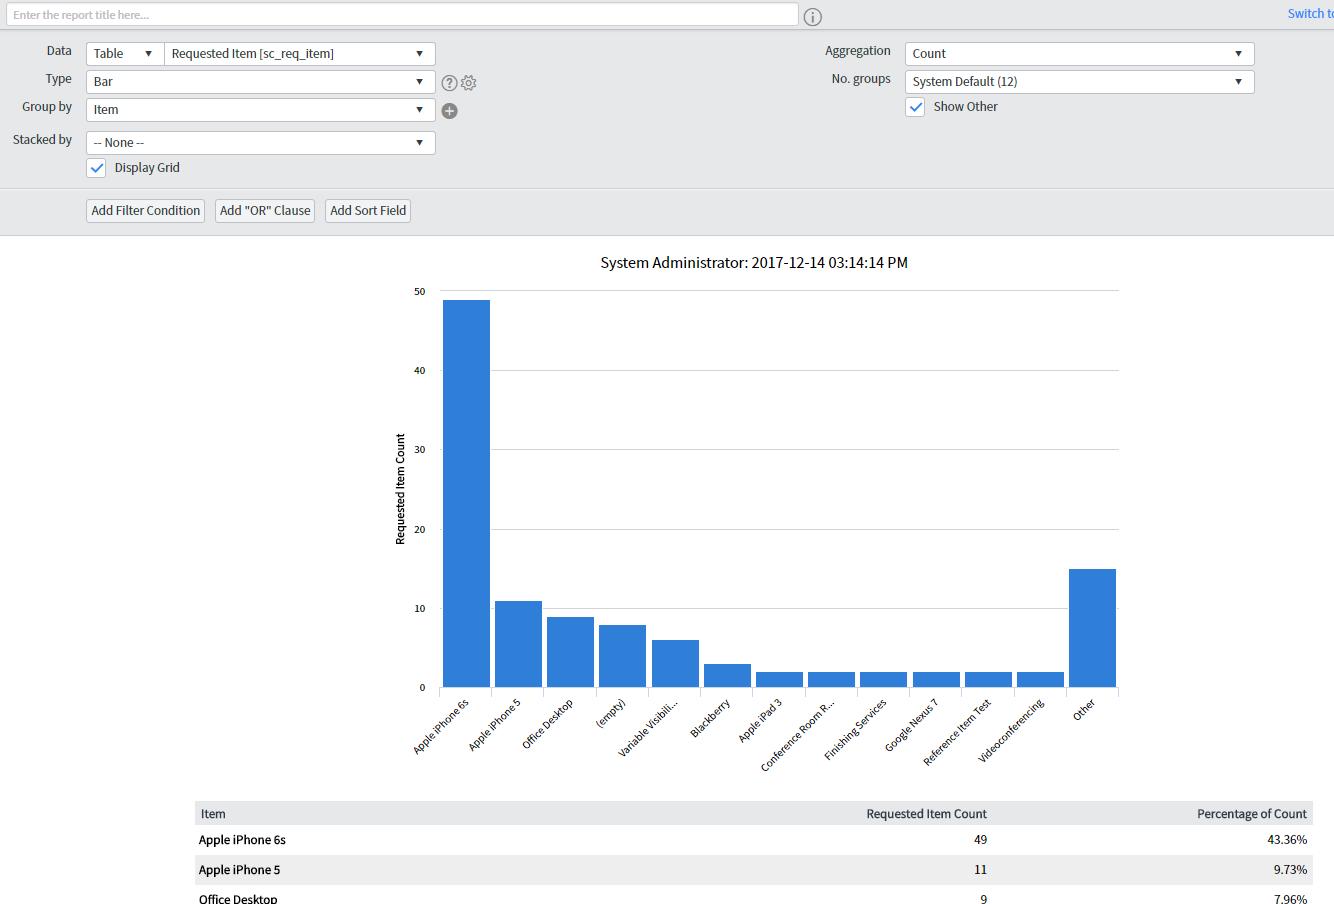
Do you need the 0s or can you assume that items not on the list have 0 requests made against them? Is this the kind of info you're looking for (note that the table provides the count numbers if you don't want it in bar chart format):

Alternatively you can do a Pivot Table report as well and just ignore the Active (true/false) columns:

- Mark as New
- Bookmark
- Subscribe
- Mute
- Subscribe to RSS Feed
- Permalink
- Report Inappropriate Content
12-14-2017 01:06 PM
Your pivot table is so close - if it were using the database view I described. I also did this but I didn't like the active field in the columns. If only we could remove it. If there are no better solutions I will accept yours as the correct answer.
Yes we need the 0's because we want to also identify catalogue items that aren't being used. I'll admit that this specific instance is easy to solve through exporting the data or running a script etc, but I'm sure there are other scenarios where something like this will be useful.
- Mark as New
- Bookmark
- Subscribe
- Mute
- Subscribe to RSS Feed
- Permalink
- Report Inappropriate Content
12-14-2017 01:12 PM
If you're using a single Catalog, use that instead of the Active field.
- Mark as New
- Bookmark
- Subscribe
- Mute
- Subscribe to RSS Feed
- Permalink
- Report Inappropriate Content
05-30-2019 09:51 AM
I know this is a bit old to be commenting on but you could look at the sc_item_produced_record table. This has a list of all the records produced by catalog items. If you do your join on the sc_cat_item table you could return all the catalog items and then count the occurrence in the sc_item_produced_record table.