How can I get disk usage metrics using Agent Client Collect?
- Mark as New
- Bookmark
- Subscribe
- Mute
- Subscribe to RSS Feed
- Permalink
- Report Inappropriate Content
02-18-2022 12:26 PM
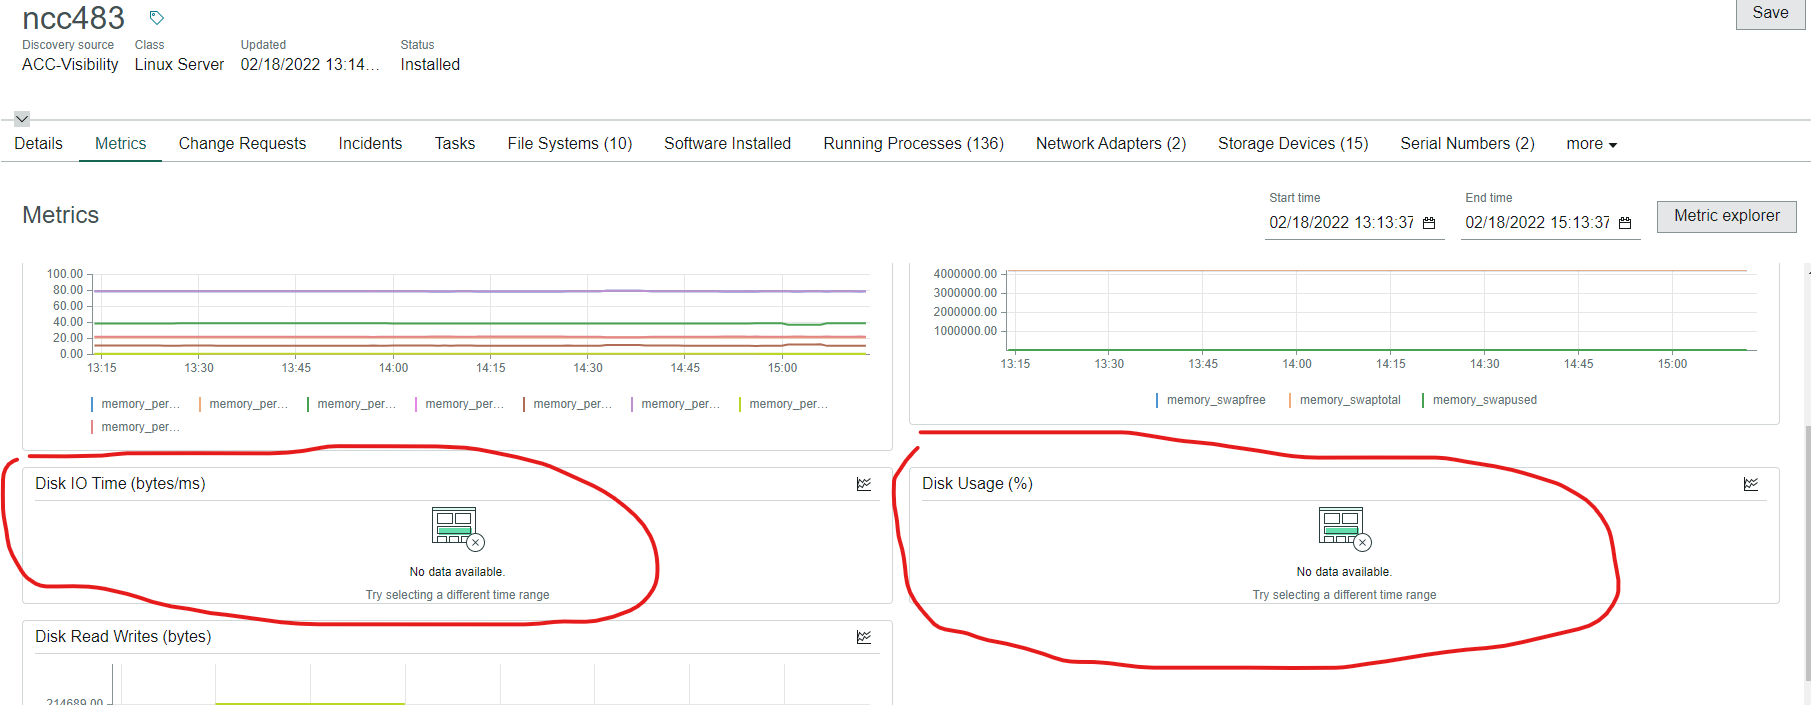
I'm trying to get disk usage metrics and alert on low available space. I have installed ACC on a linux host. I can see CPU statistics but no disk usage percentage metrics. Anyone know why that could be? I'm also having trouble with http proxy url monitor, too. I can get alerts on url timeout, but no metrics for response check.
Thanks for any pointers.
Rick
Here's some screenshots of what I mean:


- Mark as New
- Bookmark
- Subscribe
- Mute
- Subscribe to RSS Feed
- Permalink
- Report Inappropriate Content
02-22-2022 01:39 AM
Hi
To troubleshoot, check these :
1.Open Insights Explorer, and select the any CI you are monitoring using the policy. Check if you are able to see metrics related to disk under it, mainly disk_usage.used_percentage,disk.ioTime, disk.reads, disk.writes.
2. Run test checks in check instances and see above mentioned metrics values are present.
3. Search "Metric to CI" in filter navigator, search if disk related metric ids are created or not.
4. Search in MID Logs for the error from script/ text matches : "MonitorMetricParser"
Please post them here, if you go through above steps. It would be easier to trace the issue.
Thanks,
Jaideep
- Mark as New
- Bookmark
- Subscribe
- Mute
- Subscribe to RSS Feed
- Permalink
- Report Inappropriate Content
02-25-2022 01:47 AM
Thanks Jaideep.
Thanks,
Nir