- Mark as New
- Bookmark
- Subscribe
- Mute
- Subscribe to RSS Feed
- Permalink
- Report Inappropriate Content
04-19-2022 12:09 PM
Hello all,
Please pardon me if I do not properly articulate my requirements but I am willing to provide answer or additional contexts to what I need.
My requirements is to build a PA dashboard to show:
1. Total # of Open Access Tasks
2. Open Access Tasks (by Assignment Group and Manager)
3. Total # of Unassigned Access Tasks
4. Unassigned Access Tasks (by Assignment Group and Manager)
5. Total # of Access Tasks older than 7 days
6. Access Tasks older than 7 days ( (by Assignment Group and Manager)
My u_access_task table extends the u_system_access_request table which in turn extends the task table
*** We have the ITSM-Pro (if that means anything)
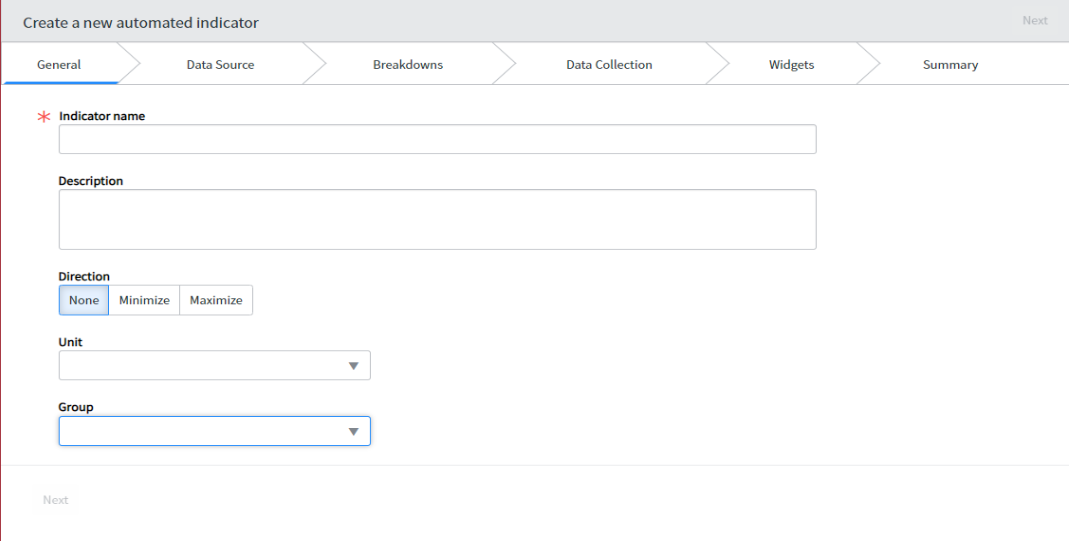
My first question is, CAN I EVEN CREATE custom indicators, breakdowns, dashboard; because when I wanted to create a new automated indicator, I do not see my u_system_access_request (System Access Request) as an option in the Group field.

Then, my other questions are, WHERE DO I START?
I thank you all for any suggestions and/or recommendations.
Solved! Go to Solution.
- Labels:
-
Performance Analytics
- Mark as New
- Bookmark
- Subscribe
- Mute
- Subscribe to RSS Feed
- Permalink
- Report Inappropriate Content
04-26-2022 01:09 AM
Hi Hola,
Follow the below steps.
1. Create an indicator source for 'u_access_task' table. Finalize the frequency before itself based on your requirement, because if you want to change it later, it's another bunch of activities that should be done.
Try to create one with the daily frequency, and use it all the time, you can use time series in widgets to display it per week, month and year etc...
2. Create the indicator with the above indicator source
3. Create the breakdown sources
4. Create the breakdowns
5. Add the breakdowns in the indicator
6. Create a PA job and add the indicators in that and then execute it
7. Create a widget with the indicator
8. Create a dashboard and then add the widgets in it. You can also add the breakdowns as dashboard breakdowns, that will act as a top filter.
- Mark as New
- Bookmark
- Subscribe
- Mute
- Subscribe to RSS Feed
- Permalink
- Report Inappropriate Content
04-19-2022 04:54 PM
You should 1st define the Indicator Source - open access tasks; you would set facts table to u_access_task and add (a) condition(s) that select(s) only opened Access Tasks. Next you can create the indicators, where you use the defined Indicator Source in step Data Source. I suppose you should 1st do the ones without Breakdowns - so that it will be easier.
Group is just for accounting purposes, you can leave it empty, it has nothing to do with from where the data comes. All you need there to select is Unit, which will be #.
- Mark as New
- Bookmark
- Subscribe
- Mute
- Subscribe to RSS Feed
- Permalink
- Report Inappropriate Content
04-26-2022 01:09 AM
Hi Hola,
Follow the below steps.
1. Create an indicator source for 'u_access_task' table. Finalize the frequency before itself based on your requirement, because if you want to change it later, it's another bunch of activities that should be done.
Try to create one with the daily frequency, and use it all the time, you can use time series in widgets to display it per week, month and year etc...
2. Create the indicator with the above indicator source
3. Create the breakdown sources
4. Create the breakdowns
5. Add the breakdowns in the indicator
6. Create a PA job and add the indicators in that and then execute it
7. Create a widget with the indicator
8. Create a dashboard and then add the widgets in it. You can also add the breakdowns as dashboard breakdowns, that will act as a top filter.