Reports in servicenow
- Mark as New
- Bookmark
- Subscribe
- Mute
- Subscribe to RSS Feed
- Permalink
- Report Inappropriate Content
01-11-2024 06:26 AM - edited 01-11-2024 06:28 AM
- Mark as New
- Bookmark
- Subscribe
- Mute
- Subscribe to RSS Feed
- Permalink
- Report Inappropriate Content
01-11-2024 11:06 AM
Hi Atul,
Thanks for the response.
This is not helping, tried these options. Could you please help if there is some similar functionality in PA we can utilize. If yes, kindly share the supporting docs.
Thank you
- Mark as New
- Bookmark
- Subscribe
- Mute
- Subscribe to RSS Feed
- Permalink
- Report Inappropriate Content
01-12-2024 12:10 AM
Hi @Alia ,
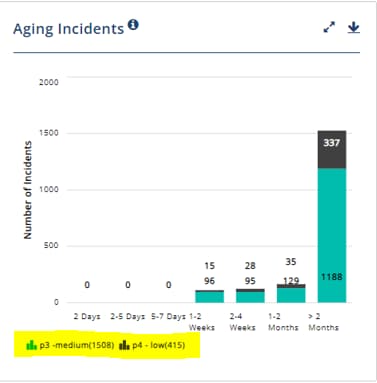
The count on the x-axis is not a possible utilizing the stacked column chart. Instead if you utilize the pie, donut or semi-donut, then the count will be available on the X-axis. The only thing you can do on a column chart is, to have score shown directly on the columns:

If my answer has helped with your question, please mark my answer as accepted solution and give a thumb up.
Best regards
Anders
If my answer has helped with your question, please mark my answer as the accepted solution and give a thumbs up.
Best regards
Anders
Rising star 2024
MVP 2025
linkedIn: https://www.linkedin.com/in/andersskovbjerg/
- Mark as New
- Bookmark
- Subscribe
- Mute
- Subscribe to RSS Feed
- Permalink
- Report Inappropriate Content
01-15-2024 04:15 AM
Thanks Anders.
Observed the same in the PDI as well. Its working with Pie, donuts but not bars. However i was thinking of any PA configuration which help in achieving the same.
- Mark as New
- Bookmark
- Subscribe
- Mute
- Subscribe to RSS Feed
- Permalink
- Report Inappropriate Content
01-15-2024 04:21 AM
Hi @Alia ,
Not to my knowledge. Basic, then the score will be displayed directly on the graph itself instead of below x-axis / in the x-axis.
If my answer has helped with your question, please mark my answer as accepted solution and give a thumb up.
Best regards
Anders
If my answer has helped with your question, please mark my answer as the accepted solution and give a thumbs up.
Best regards
Anders
Rising star 2024
MVP 2025
linkedIn: https://www.linkedin.com/in/andersskovbjerg/
