


Adam Stout

ServiceNow Employee
Options
- Subscribe to RSS Feed
- Mark as New
- Mark as Read
- Bookmark
- Subscribe
- Printer Friendly Page
- Report Inappropriate Content
03-19-2020
04:59 PM
Identifying Impactful Slow Reports
Want to look good and make your users happy? Fix or get rid of the performance hog reports that cause poor UX and then get ready for smiling users.
But how do you figure out which reports are the most impactful to performance? You may have 1,000 reports, you may have 10,000 reports, you may even have 50,000 reports on your instance... where should you focus your attention?
Let’s dig into what we can to track report performance.
[If you are looking to track Dashboard Usage, check out this blog.]
Out of the Box Report Statistics
Report Statistics is a great place to start. Out of the box, the report_stats table gives you a quick way to access how long reports are taking to load, and when the last time they were viewed.
The report_stats table is great to be able to identify your long-running reports that have been run recently and have seen a lot of activity in their lifetime. The Report field is a reference to sys_report so you can dot-walk to any report attribute you need (for example, filtering to incident tables or HR tables).
Report Statistics are active by default, and no customization is needed to take advantage of this great resource to help you focus on the reports that need it.
Tracking Individual Views
Report Statistics is a great start, but sometimes we need to know more about the usage of reports. For instance, we want to know not only that a report was run recently, but we want to know who viewed it. We want to know not just that it is run a lot, but how many times it has been run recently.
To track usage at this level, we need to build on the out of the box capabilities to store this info.
Creating a Table
Note: Creating a table may have licensing implications depending on your contract. If you have questions about this, contact your account representative.
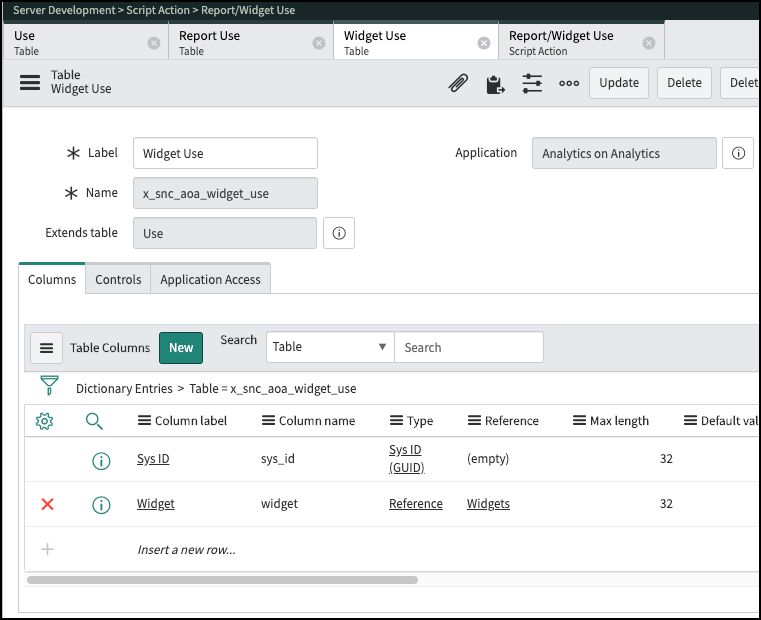
I created a scoped application to hold the objects we need named x_snc_aoa. I want to track both report views and Performance Analytics widget, so I created three tables.
- x_snc_aoa_use – This the base table for my usage tracking
- x_snc_aoa_report_use – Extends use and tracks the report (and anything specific to reports)
- x_snc_aoa_widget_use - Extends use and tracks the widgets (and anything specific to widgets)


Populating the Tables
Now that we have my tables, we need to populate them. To do this, we are taking advantage of the awesomeness of the Now Platform. When reports and widgets are viewed, there is an Event created named “report.view”.
This event gives us:
- Report (Instance)
- User (User ID)
- Load Duration (Param1)
- Dashboard tab or homepage (Param2)
- View time (Created time)

To process this event, we need a Script Action. There is already a Script Action to populate the report_stats records so we will add one.

Here is the script I used in my script action. You may need to adjust to fit your specific requirements. As always, be sure to test this in your environment before using it.
(function(event) {
    var userSysId = event.user_id;
    var executionTimestamp = event.sys_created_on;
    var executionDuration = event.parm1;

    // homepage and widget sys id are passed in parm2 as <homepage>/<widget>
    var parm2 = (event.parm2) ? event.parm2.split('/') : [];
    var homepageSysId = (parm2.length > 0) ? parm2[0] : null;
    var widgetSysId = (parm2.length > 1) ? parm2[1] : null;
    var isScheduledRun = (parm2.length > 2) ? parm2[2] : null;
    var bIsScheduledRun = isScheduledRun != null && isScheduledRun === 'true' ? true :  false;
   var repLog = null;
    if(event.table == 'pa_widgets')
    {
    repLog = new GlideRecord('x_snc_aoa_widget_use');
        repLog.setValue('widget', event.instance);
    } else {
    repLog = new GlideRecord('x_snc_aoa_report_use');
        repLog.setValue('report', event.instance);
        repLog.setValue('widget', widgetSysId);
    }
    repLog.setValue('user', userSysId);
    repLog.setValue('load_duration', executionDuration);
    repLog.setValue('viewed', executionTimestamp);
    repLog.setValue('homepage', homepageSysId);
    repLog.setValue('scheduled', bIsScheduledRun);
    repLog.insert();
}(event));
Data Hygiene
Depending on the size of your instance, this data can grow quickly. To ensure it doesn’t get out of hand and cause issues on your instance, be sure to create a table cleaner to purge the data.
I created one to remove data over six months. You may need to adjust this setting depending on data volume. Table rotation may be an acceptable option as well.
Use the Data
Now that we have the data in our tables, there is a lot we can do. I built a quick dashboard that lets me look at where are the top reports based on any of the report attributes.
We can use the attributes from reports and users (I used the user as an example here) to zoom in to what they are viewing.

With this data, we can create reports on:
- Reports getting slower over time
- Which departments are viewing specific reports
- Are users visiting reports at expected intervals
- Top (specific) report consumers to consult before changes are made
- Users experiencing long load time (key when some users have different performance profiles)
- Quite a few more...
Once we have something we want to focus on, we can apply Performance Analytics to this data as well to trend our usage KPIs over time to help us drive greater adoption and performance of our analytics.
Let’s Go!!!
Now that you know how to do this, do it. Start tracking this data as soon as possible. Since we leverage events, you can’t get it historically once the events are deleted from the instance.
What are the key things do you focus on? Leave me a comment about what analytics you built on this data.
Labels:
- 18,298 Views
6 Comments
You must be a registered user to add a comment. If you've already registered, sign in. Otherwise, register and sign in.