The CreatorCon Call for Content is officially open! Get started here.

Adam Stout
ServiceNow Employee
ServiceNow Employee

Overview 

In many support offices, there are areas with large monitors on the wall showing off key metrics.  What better way to demonstrate to visitors that you are on top of your workload and ensure your team is always aware of key information? 

Below, we will walk through some important considerations prior to setting this up and how to set this up for your organization. 

Performance Considerations 

Real-Time Reports 

For the best performance, instead of refreshing the entire dashboard, you can use real-time reports.  Real-time reporting is only supported for single scores, but they are updated in real time without a full refresh of the browser, with no action required by the viewer, and very little impact to the instance. 

Refresh Time 

When refreshing a dashboard tab, all of the widgets that are viewable are refreshed.  To minimize the performance impact on your instance, we recommend that you set the reload/refresh interval to no less than 5 minutes.  Refreshing every few seconds can put an unnecessary load on your instance.  

One good option for refresh time is to use real-time reports for some single scores (e.g., open incidents, unassigned incidents, etc.) with a full refresh scheduled in a much longer period (every 15 or 20 minutes). 

Actionable and Performant Content 

It is important to ensure that only actionable and well-performing reports are included in this report.  For example, a bar chart of the number of closed incidents by month for the past two years requires the examination of large amounts of data and doesn’t provide current actionable information.  Instead, include reports that focus on the open incident queue and perhaps the number of incidents closed in the last 24 hours. 

If something like this is needed, be sure to look at leveraging Performance Analytics which can visualize trends with a significantly lighter impact on your system and with a faster response time.  

On a related note, if you are looking to get the most visually attractive dashboard, take a read through this pos, Make Better Looking Dashboards with Content Blocks

Setup and Configuration 

Let talk about how to set up an auto-refreshing dashboard. 

Configuring a User 

The first thing you need to set up a wall display is to identify the user to be used.  There are several items to consider when setting up this user.  

It is recommended to not use a real person’s login credentials.  Instead, create a dedicated system user that is specifically designed for this purpose.  This will allow you to ensure on the proper controls are in place as well as allow you to track any potential performance issues to this purpose.  

Considerations 

  • Password Reset Requirements – Many organizations require users to change their password every 90 days.  You may want to except this system user from this requirement or ensure you have a process in place to handle this password change. 
  • Access Control Lists – To ensure this user cannot be misused (to view or update a specific incident), create a role specifically for this purpose and create ACLs that give the minimum access possible to meet your displaying needs.  For example, ensure this role only has read access to the tables needed and possible only specific fields. 

Configure Display 

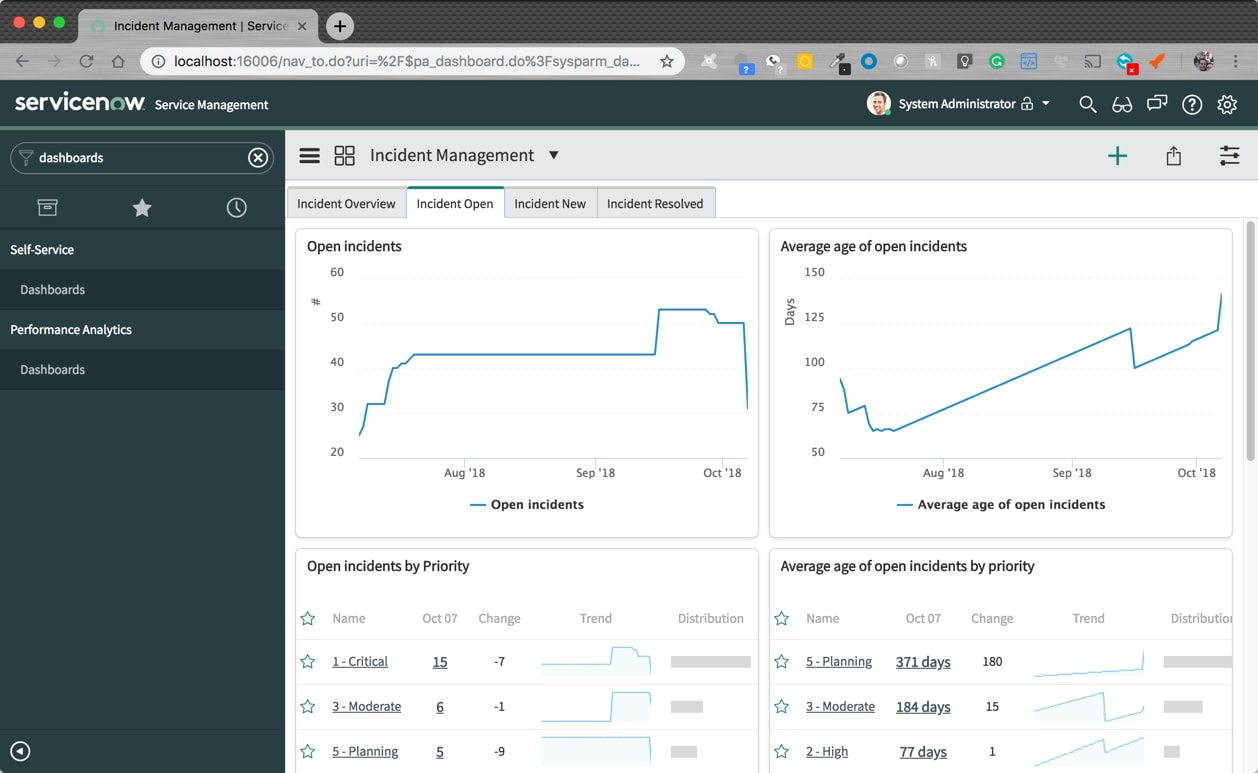
Typically, we view dashboards in the full frame including the ServiceNow header and the navigation bar.  This looks something like this: 

  find_real_file.png

The first task is to open the dashboard without the frame.  To do this, simply edit the URL to remove the nav_to.do. 

Original URL: 

http://myinstance.service-now.com/nav_to.do?uri=%2F$pa_dashboard.do 

Modified URL: 

http://myinstance.service-now.com/$pa_dashboard.do   

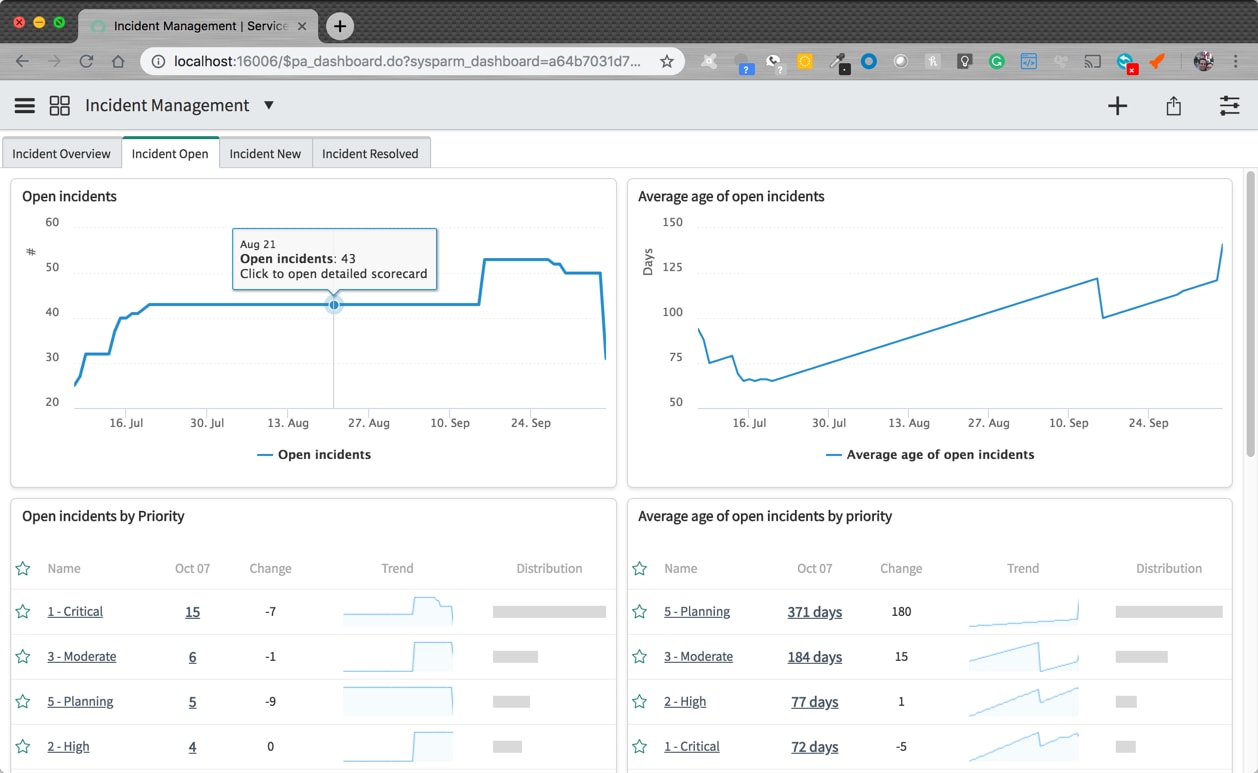
This will remove the frame around the dashboard which will look something like this: 

 find_real_file.png

The URL above the load the last dashboard viewed by the user.  To get the URL of a specific dashboard, select copy the URL view the dashboard menu: 

 find_real_file.png

This will give us the full URL like this: 

http://myinstance.service-now.com/$pa_dashboard.do?sysparm_dashboard=a64b7031d7201100b96d45a3ce610335&sysparm_tab=f8bbb031d7201100b96d45a3ce610363&sysparm_cancelable=true&sysparm_editable=false&sysparm_active_panel=false  

Two import items in this URL include the sysparm_dashboard parameter which identifies which dashboard to display and sysparm_tab which identifies which tab to display initially. 

Alternatively, instead of rotating through multiple tabs, separating these tabs into multiple dashboards (only shared to the system user we created for this dashboard).  This will recapture the screen space taken up by the tabs.  

find_real_file.png

Auto-Refreshing 

To handle rotating through the tabs and auto-refreshing the dashboard, use an auto-refreshing extension for your browser such as Revolver for Chrome. 

Note:  There are many similar extensions for different browsers.  ServiceNow does not recommend any specific browser extension. 

When selecting the URL to display, ensure that you enter the correct dashboard and tab.   If you want to rotate through multiple tabs, you will have multiple URLs which are identical except for the sysparm_tab parameter. 

Set Browser to Full Screen 

To use as much screen space as possible, be sure to full screen maximize the amount of screen space available. 

Conclusion 

Prominently displaying your real-time KPIs is a great way to keep your team motivated and show off your successes.  

20 Comments
paulvoorn
ServiceNow Employee
ServiceNow Employee

Great tips, Adam.  Some extra thoughts driven by the huge success of the dashboard you helped me create last year...

  • have the display at human level... not mounted high up on a wall. And have a mouse handy for drilling down...We often had impromptu team meetings huddled around the screen and pointing at it.  It led to great discussions.
  • a large hi-res display allows for a lot more 'content' than you might think. Don't be afraid to pile it on. 
  • we deployed a screen-switcher app to cycle through what we were showing.  And ok, yes, we had a March Madness bracket and then World Cup pool running occasionally too, but having different chart sets and data rotating made it all very appealing.

Net-net... not only did we get better visibility to trends and overall progress... but we also ended up with better team 'identity'/engagement/morale and even people from other departments would come by and be intrigued.

Simon90
Kilo Explorer

Adam! you ledgend.  I was about to give up hope that anyone had ever considered doing this, been to so many articles until i found your article.  Appreciate it

Simon

Adam Stout
ServiceNow Employee
ServiceNow Employee

Glad to hear it is still useful.

 
davjohn
Kilo Expert

Hi Adam,

Sorry if it is a stupid question. Should the Wall TV be connected to an actual computer or do you cast them?

davjohn
Kilo Expert

Let's say 10 teams requires 10 TV mounted on each floor, Should each team have one dedicated user-created or just use one TV user created and show 10 dashboards in 10 TV's?

Adam Stout
ServiceNow Employee
ServiceNow Employee

In the past, I have connected them to a computer, but casting should be fine.  You just need to be able to get a web browser on a screen.

Adam Stout
ServiceNow Employee
ServiceNow Employee

I think it depends on the data.  If the same user will have access to view all the data, sharing shouldn't be an issue.  The reason we use different users is to protect against one being compromised.

mehershanti
Tera Contributor

Legend indeed!

Adam, wondering if we have a way to set these dashboards to auto refresh every 5 minutes instead of that chrome extension?

Adam Stout
ServiceNow Employee
ServiceNow Employee

I have seen people write a custom widget that has some client said javascript set to refresh.  This should work but the extension seems easier to me. 

There is not a very simple way to do this because when we had that (with homepages) we saw many users using this which led to taxing the system for very little (or no) benefit.

gav1n
Giga Contributor

I know this is an old question - but I've been recently looking for a solution. One that ideally uses the in-built refresh capabilities for widgets as opposed to refreshing the entire page using a browser plugin. 

I found some old code to refresh widgets (that had stopped working due to changes in the menu structure) and have updated this so it works, I've also added code to automatically change the tab.

So this code allows you to either refresh widgets on a single tab, or cycle through all the tabs within your dashboard.

find_real_file.png

  1. To use, simply go to add a new widget to your dashboard (click the plus icon).
  2. Choose the category of "Content Blocks"
  3. Then choose "*New Dynamic Content", then Add. (This adds an empty content block to your dashboard)
  4. Now choose "click here" on the content block.
  5. Give it any name ie "*Auto refresh" (note: this will now be available to use in any dashboards)
  6. Then replace the example code with the below. And click Submit.

Ensure this widget is visible as soon as the dashboard loads. If it is off-screen, it will not run.

Also, you do not need to add this widget to each tab. Just place it on the first tab. 

Note: I've seen that occasionally when it refreshes a lot of widgets, some appear with "ERROR" - however these still refresh and the error message vanishes. I'm not sure why.

You can reconfigure reload times, and turn off the auto-tab changing within the widget itself.

Obviously, this may break if ServiceNow makes a lot of changes to their dashboards.

Have fun! 

<?xml version="1.0" encoding="utf-8" ?>
<j:jelly trim="false" xmlns:j="jelly:core" xmlns:g="glide" xmlns:j2="null" xmlns:g2="null">
	<style>.counter{display:block;margin:2px 0px;color:#969696}.sel_active{float:right;margin:5px}.refresh-select{width:auto;display:inline}</style>
	<script>
		var r_sec = 0;
		var t_now = null;
		var t_next = null;
		var t_last = null;
		var myInterval = null;

		//readTime(); // causes to ignore loss of focus
		
		//auto read seconds on selector change
		function readTime() {
			r_sec = gel('sel_time').value;
			localStorage['saved_time'] = r_sec;
			clearInterval(myInterval);
			reloadDashboard();
		}
		
		// refresh using actual page script
		function refreshPage() {
		var scope = angular.element(document.getElementsByClassName("sn-canvas-main ng-scope edit-mode show-panel")).scope();
		scope.$apply(function(){scope.msg = ' '; })
		scope.refreshAllPanes();	
		}
		
		function nextTab() {
		var scope = angular.element(document.getElementsByClassName("sn-canvas-main ng-scope edit-mode show-panel")).scope();
		scope.$apply(function(){scope.msg = ' '; })
		// total tabe scope.tabs.length;
		var tabs=scope.tabs;
		var nexttab=0;
		// Active tab
		for (var i=0; i &lt; tabs.length; i++) {
		if (tabs[i].isActive) {break;}							 
		 }
		nexttab=i+1;		
		if (i>=tabs.length-1) nexttab=0;
		var tab=tabs[nexttab];
		scope.setActiveTab(tab);
		}
		
		//auto read active (true/false) on selector change
		function readActive() {
			r_active = gel('sel_active').value;
			localStorage['saved_active'] = r_active;
			clearInterval(myInterval);
			reloadDashboard();
		}
		
		function readTabChange() {
			r_tabs = gel('tab_active').value;
			localStorage['saved_tabs'] = r_tabs;
		}
		
		//refresh now on button click
		function refreshNow() {
			refreshPage();
			clearInterval(myInterval); //always clear interval after refresh
		}
		
		//run interval every 1 second
		function runInterval(){

			if(t_now &lt; t_next) {
				// the definition of "('0' + t_X).slice(-2)" is there to print the leading zeros in front
				$j('#refresh .counter').text('Now: '+t_now.getHours()+':'+ ('0'+t_now.getMinutes()).slice(-2) +':'+ ('0'+t_now.getSeconds()).slice(-2) +' Next: '+t_next.getHours()+':'+('0'+ t_next.getMinutes()).slice(-2) +':'+ ('0'+t_next.getSeconds()).slice(-2) +' Last: '+t_last.getHours()+':'+ ('0'+t_last.getMinutes()).slice(-2) +':'+ ('0'+t_last.getSeconds()).slice(-2));
		
				//console.log('Now: '+t_now.getSeconds()+', Next: '+t_next.getSeconds());
		
				t_now.setSeconds(t_now.getSeconds() + 1);
			} else {
				//we refresh all widgets
				if(r_tabs == 'true') {
				nextTab();
			} else {
			refreshPage();
			}
		
				clearInterval(myInterval); //always clear interval after refresh
				
				//console.log('we refresh dashboard...');
			}
		}
		
		function reloadDashboard() {
			//read time in seconds
		    r_sec = localStorage['saved_time'] || gel('sel_time').value; //read saved option from cache after refresh or from the selector
			$j('#sel_time').val(r_sec); //we set it to the selector
		
			//read tab change
			r_tabs = localStorage['saved_tabs'] || gel('tab_active').value;;
			$j('#tab_active').val(r_tabs); //we set it to the selector
		
			//read active, true or false
			r_active = localStorage['saved_active'] || gel('sel_active').value; //read saved option from cache after refresh or from the selector
			$j('#sel_active').val(r_active); //we set it to the selector
		
			if(r_active == 'true') {
				t_now = new Date(Date.now());
				t_next = new Date(t_now.getTime());
				t_next.setSeconds(t_next.getSeconds() + parseInt(r_sec)); //we sum read seconds to calculate next refresh
				t_last = new Date(t_now.getTime()); //save last run, as t_now is displayed on real time. eg. t_now=t_now+1
				myInterval = setInterval(runInterval, 1000); //run every 1 sec.
			} else {
				$j('#refresh .counter').text('Stopped. Set it to active to start.');
			}
		}
		
		$j('#sel_time').val('300'); //default option is 60 seconds
		reloadDashboard();

		//if window tab is active (for optimal performance)
		$j(window).focus(function() {
			clearInterval(myInterval);
			reloadDashboard();
		});

		//if window tab is inactive (for optimal performance)
		$j(window).blur(function() {
			if(r_tabs == 'false') {
			clearInterval(myInterval);
			$j('#refresh .counter').text('Stopped. Tab was inactive.');
		}
		});
	</script>
	<div id='refresh' class='panel-body'>
			<span class='counter'></span>

		Refresh:
		<select id='sel_time' class='form-control refresh-select' onchange='readTime()'>
			<option value='60'>1 min.</option>
			<option value='300' selected="selected">5 min.</option>
			<option value='900'>15 min.</option>
			<option value='1800'>30 min.</option>
			<option value='2700'>45 min.</option>
		</select>
		<button type='button' class='btn btn-default' onclick='refreshNow()'>Refresh now</button>
		<span class='sel_active'>
			Active:
			<select id='sel_active' class='form-control refresh-select' onchange='readActive()'>
				<option value='true'>true</option>
				<option value='false'>false</option>
			</select>
			Cycle Tabs:
			<select id='tab_active' class='form-control refresh-select' onchange='readTabChange()'>
				<option value='false'>false</option>
				<option value='true'>true</option>				
			</select>
		</span>
	</div>
</j:jelly>