


Adam Stout

ServiceNow Employee
Options
- Subscribe to RSS Feed
- Mark as New
- Mark as Read
- Bookmark
- Subscribe
- Printer Friendly Page
- Report Inappropriate Content
11-14-2018
01:17 PM
Overview
Being able to understand your users is critical in order to meet their needs. By leveraging the power of the Now Platform, we can easily track our users' behaviors and adjust our solutions to improve their overall satisfaction.
Dashboard views are stored along with other pages viewed in the sys_ui_navigator_history table. While the data is here, it is protected by ACLs which restricts the viewing to the admin role and the user who for whom the history is for. The Navigator History included the URL that was viewed which does contain the sys_id of the dashboard, but not in a reportable form.
To make this vital information more accessible, we will create a table to hold just the dashboard views in a very analytic-friendly format. Then we will create a scheduled job to populate this new table daily.
If you want to track report views, take a look at this related post. To understand what reports are on a dashboard or what dashboards a report is on, take a look at this post.
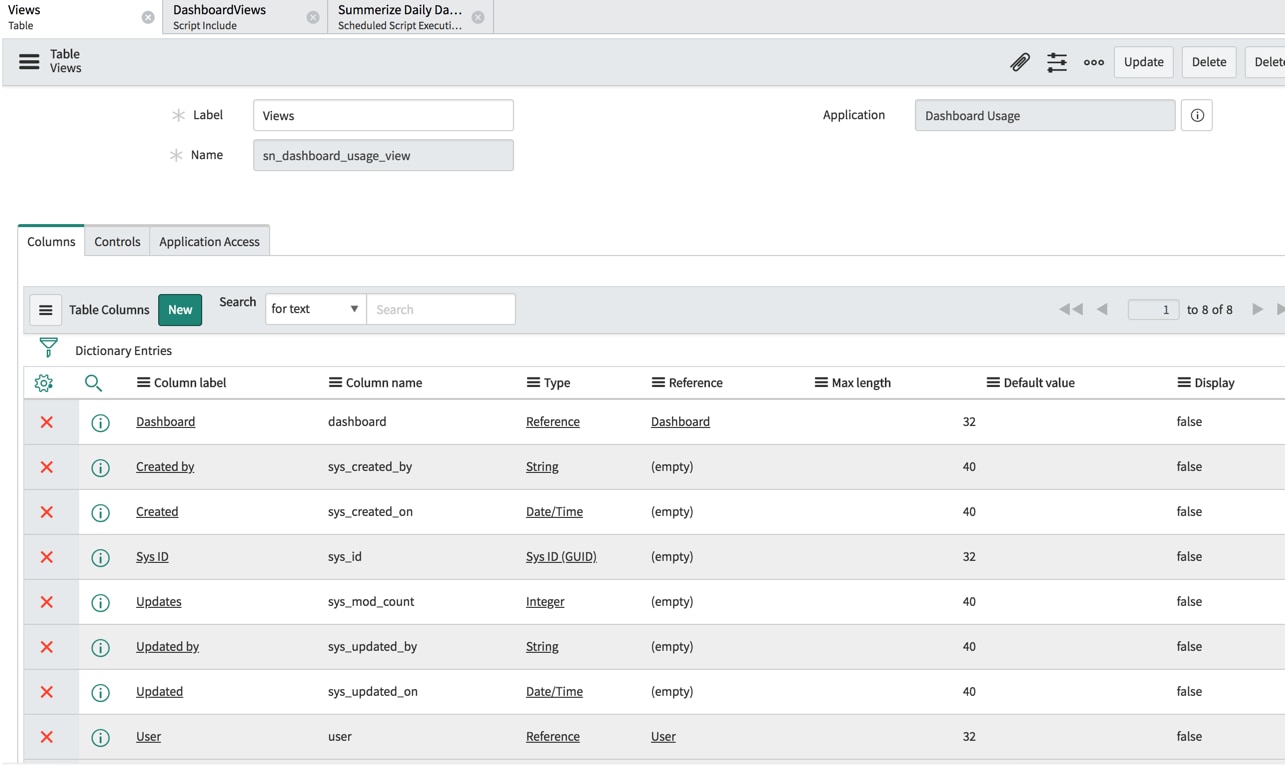
Create a Table
The table we need is very simple and straightforward. In addition to the normal system fields, we only need two fields:
- Dashboard – A reference to pa_dashboards
- User – A reference to sys_user
Scheduled Job
Now that we have a table, we have to populate it. To accomplish this, we used a Scheduled Script Execution (a scheduled job).
Note: While all the logic can all be done in the scheduled job, for this example, I created a script include to hold all the logic to that parts could be reused in the future as well as holding additional logic for other related or similar scheduled jobs.
Here is some sample logic for the processing. This may need to be adjusted to fit your specific needs or in a future version of ServiceNow. As with any script, this should be tested prior to use in any production environment.
/* sn_dashboard_usage.DashboardViews */
var DashboardViews = Class.create();

DashboardViews.prototype = {

    initialize: function ()
    {
        this.logSource = gs.getProperty('sn_dashboard_usage.log.source', 'DashboardViews');
        this.verboseLog = (gs.getProperty('sn_dashboard_usage.log.verbose', 'false') == 'true');
    },

    loadViews: function (encodedQuery)
    {
        var bus = [];
        var gr = new GlideRecord('sys_ui_navigator_history');
        if(encodedQuery)
        {
            gr.addEncodedQuery(encodedQuery);
        }
        gr.addQuery('url', 'STARTSWITH', '$pa_dashboard.do?').addOrCondition('url', 'STARTSWITH', '$dashboards.do?');
        gr.query();
        this._info('Loading Dashboard views from UI Navigstor History to Usage table: ' + gr.getRowCount());
        while(gr.next())
        {
            var match = /sysparm_dashboard=([a-z0-9]{32})/g.exec(gr.getValue('url'));
            var dashboard_sys_id = match[1];
            if(gs.nil(dashboard_sys_id))
            {
                this._warning('Unable to parse dashboard sys_id from: ' + gr.getValue('url'));
                continue;
            }
            this.addDashboardUsage(dashboard_sys_id, gr.getValue('user'), gr.getValue('sys_created_on'));
        }
        this._info('Dashboard Usage views transfer complete');
        return true;
    },

    addDashboardUsage: function(dashboard, user, viewTime)
    {
        var gr = new GlideRecord('sn_dashboard_usage_view');
        gr.autoSysFields(false);
        gr.setValue('dashboard', dashboard);
        gr.setValue('user', user);
        gr.setValue('sys_created_on', viewTime);
        gr.insert();
    },

    _info: function(s)
    {
        gs.info("[{0}] {1}", this.logSource, s);
    },

    _warning: function(s)
    {
        gs.warn("[{0}] {1}" + s, this.logSource, s);
    },

    _error: function(s)
    {
        gs.error("[{0}] {1}" + s, this.logSource, s);
    },

    _debug: function(s)
    {
        if (this.verboseLog == 'true') {
            //debug logs only show if Verbose
            gs.debug("[{0}] {1}" + s, this.logSource, s);
        }
    },

    type: 'DashboardViews'

};
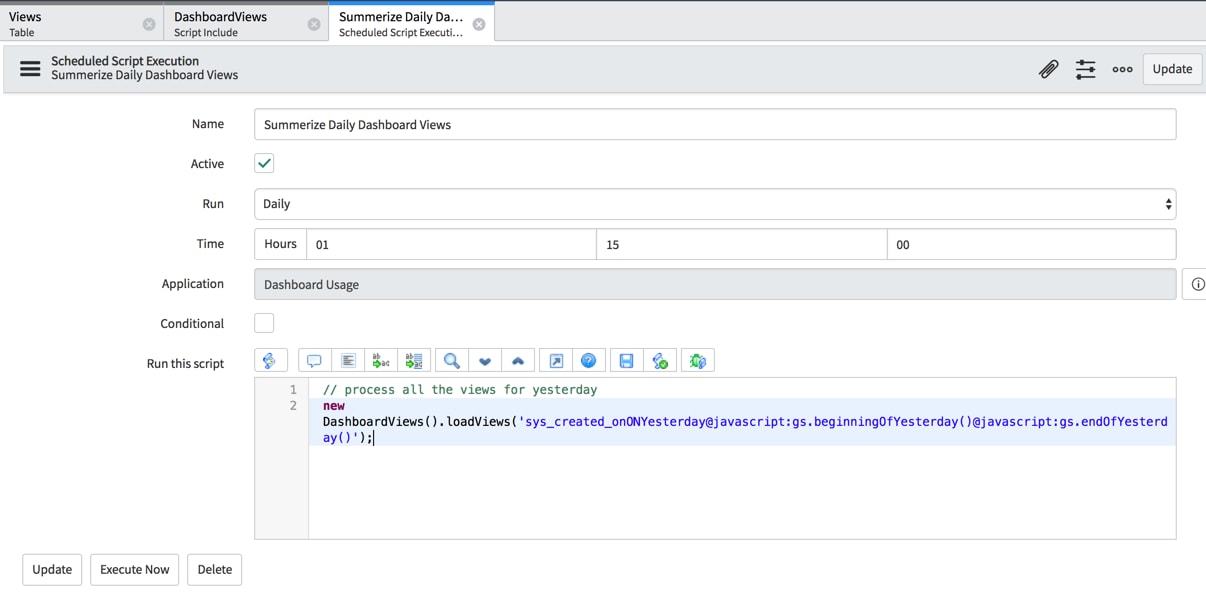
Now that we have the logic, I call this in the scheduled job:
// process all the views for yesterday
new DashboardViews().loadViews('sys_created_onONYesterday@javascript:gs.beginningOfYesterday()@javascript:gs.endOfYesterday()');
We can “Execute Now” to load the data into our new table right now and this will ensure that the data is loaded daily going forward. If desired, we can also call the same function (with a modified parameter) via a Fix Script to load in more historical data. The data should exist in the table since the time your instance upgraded to Jakarta or was provisioned if you started on Jakarta or later.
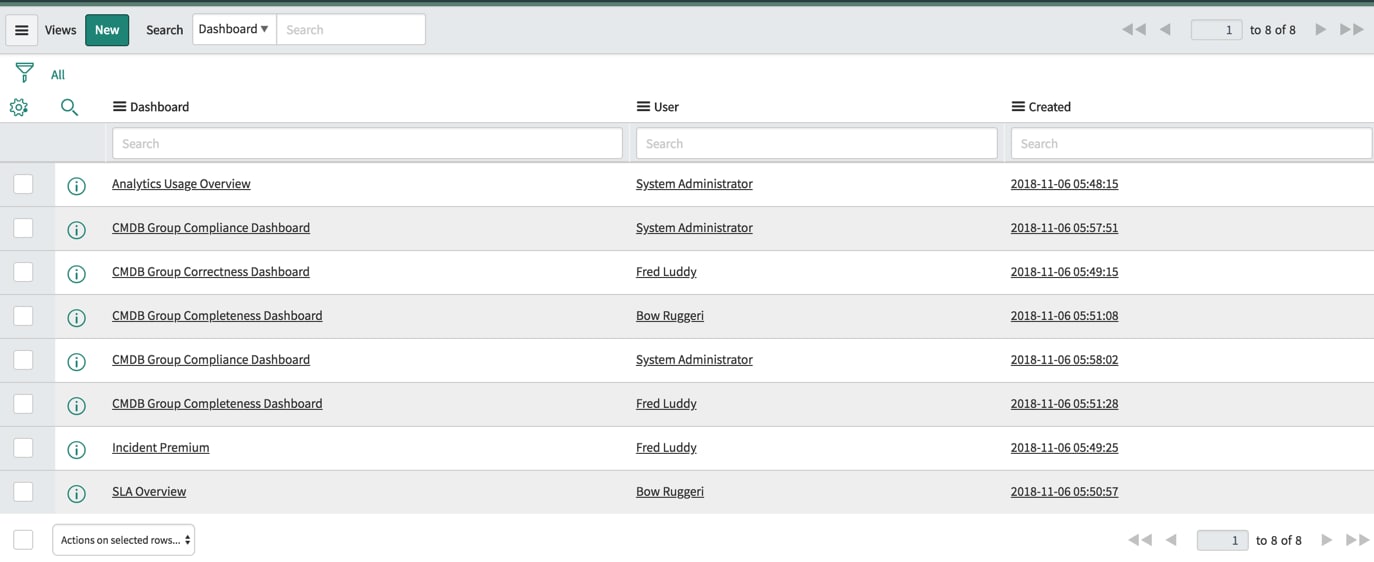
Using the Data
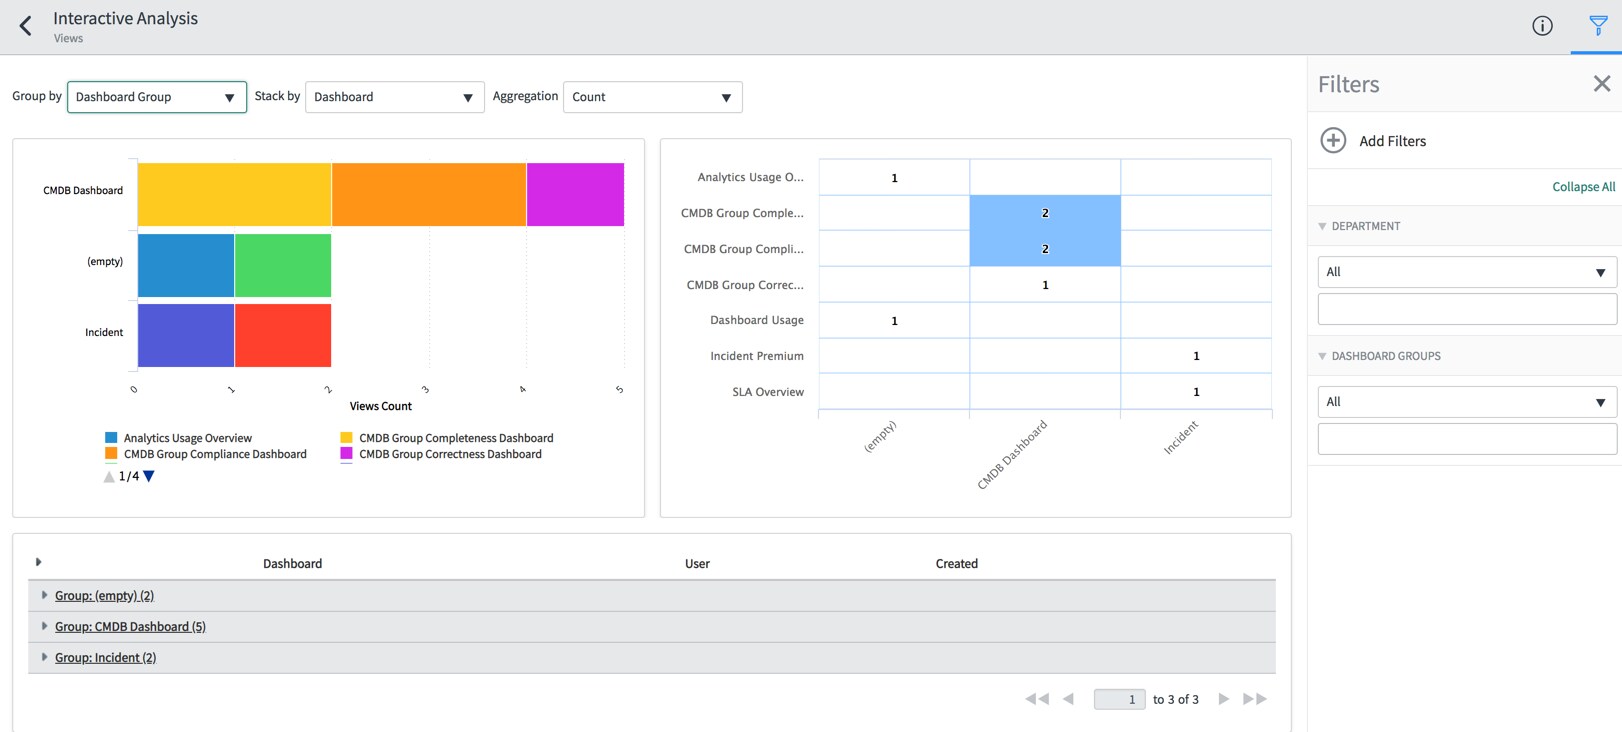
The new table now shows the dashboard viewed by whom it was viewed and when it was viewed:

This is also a great use case for leveraging Interactive Analysis on this data to quickly review this data to gain meaningful insights without needing to export the data.
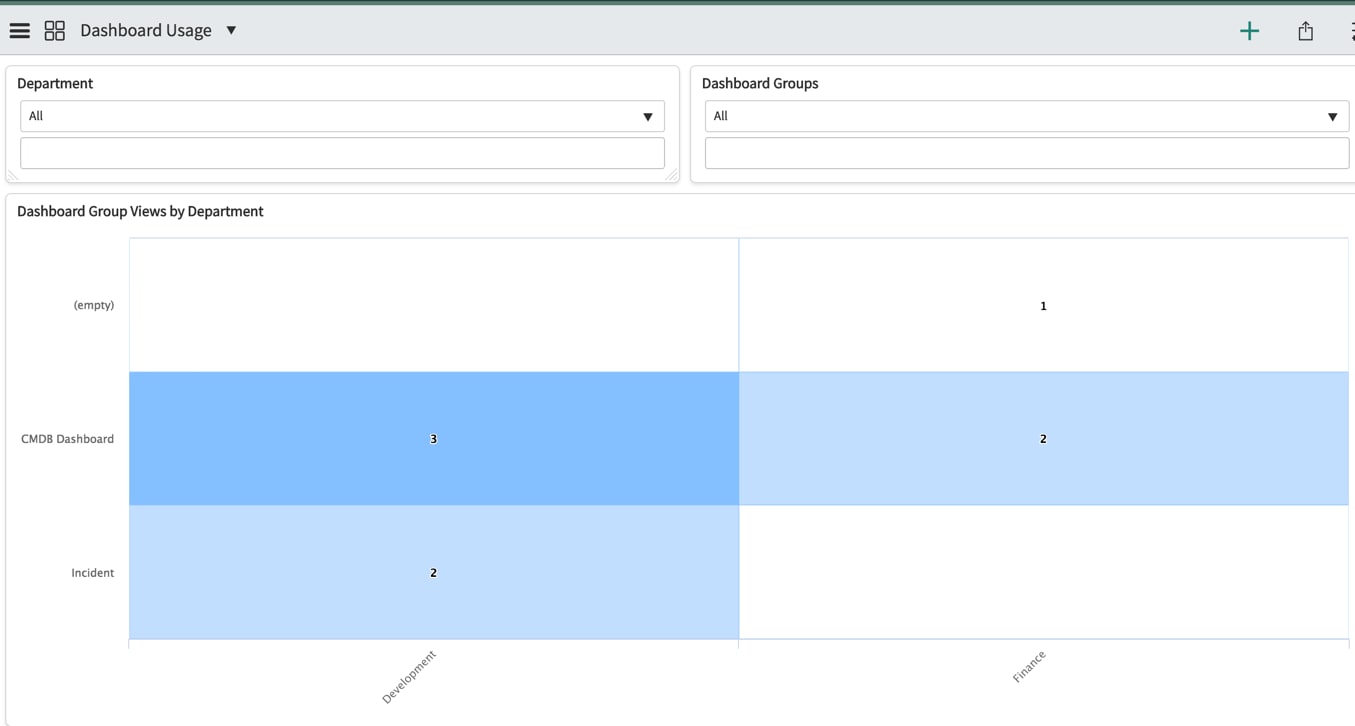
Trending
If you are looking to use this in formulas (perhaps for some type of views per user ratio) or to use dashboard views as a KPI, then you will want to configure Performance Analytics on top of this new table.
The data in the new table is also in a great format to add Performance Analytics (no scripting should be required since we converted the data to references as part of the scheduled job. If you only intended to view the views, standard reporting may be all you need since we can produce trend reports on this data based on the view time.
Conclusion
Understanding your users is key to meeting their needs. By leveraging the power of the Now Platform, we can easily track our users’ behaviors to better meet their needs.
- 70,167 Views
48 Comments
- « Previous
-
- 1
- 2
- 3
- 4
- 5
- Next »
You must be a registered user to add a comment. If you've already registered, sign in. Otherwise, register and sign in.

