- Mark as New
- Bookmark
- Subscribe
- Mute
- Subscribe to RSS Feed
- Permalink
- Report Inappropriate Content
10-08-2020 01:11 PM
How can I create a report that uses a vertical bar graph stacked by date in the following format: 1st bar 1 - 7 days ago. 2nd bar 8 - 14 days ago, etc.?
Solved! Go to Solution.
- Labels:
-
Multiple Versions
- Mark as New
- Bookmark
- Subscribe
- Mute
- Subscribe to RSS Feed
- Permalink
- Report Inappropriate Content
10-08-2020 01:18 PM
I dont think you can stacked by a date field unless you create an aging field in your table.
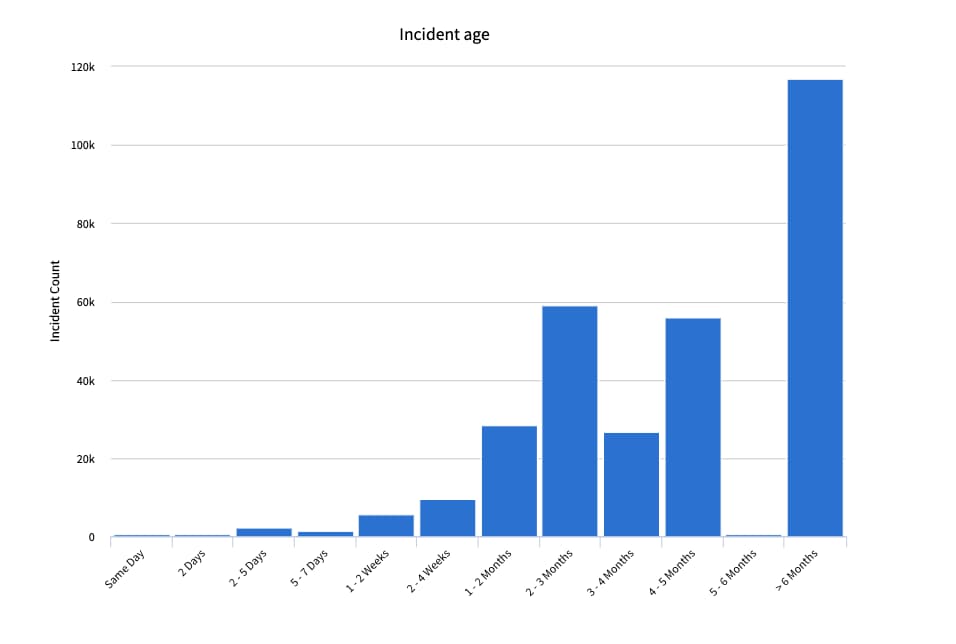
But if you group by the date field, you can get the aging report like below.

Please mark this response as correct or helpful if it assisted you with your question.
- Mark as New
- Bookmark
- Subscribe
- Mute
- Subscribe to RSS Feed
- Permalink
- Report Inappropriate Content
10-08-2020 01:18 PM
- Mark as New
- Bookmark
- Subscribe
- Mute
- Subscribe to RSS Feed
- Permalink
- Report Inappropriate Content
01-27-2021 10:35 AM
Hi Sanjiv -
Would you be willing to send me your configuration setup for this report?
- Mark as New
- Bookmark
- Subscribe
- Mute
- Subscribe to RSS Feed
- Permalink
- Report Inappropriate Content
10-08-2020 01:20 PM
Thank you! That is perfect!
- Mark as New
- Bookmark
- Subscribe
- Mute
- Subscribe to RSS Feed
- Permalink
- Report Inappropriate Content
10-08-2020 01:25 PM
Awesome... Please mark my response correct if it answered your question.
Please mark this response as correct or helpful if it assisted you with your question.