
- Mark as New
- Bookmark
- Subscribe
- Mute
- Subscribe to RSS Feed
- Permalink
- Report Inappropriate Content
10-08-2020 01:11 PM
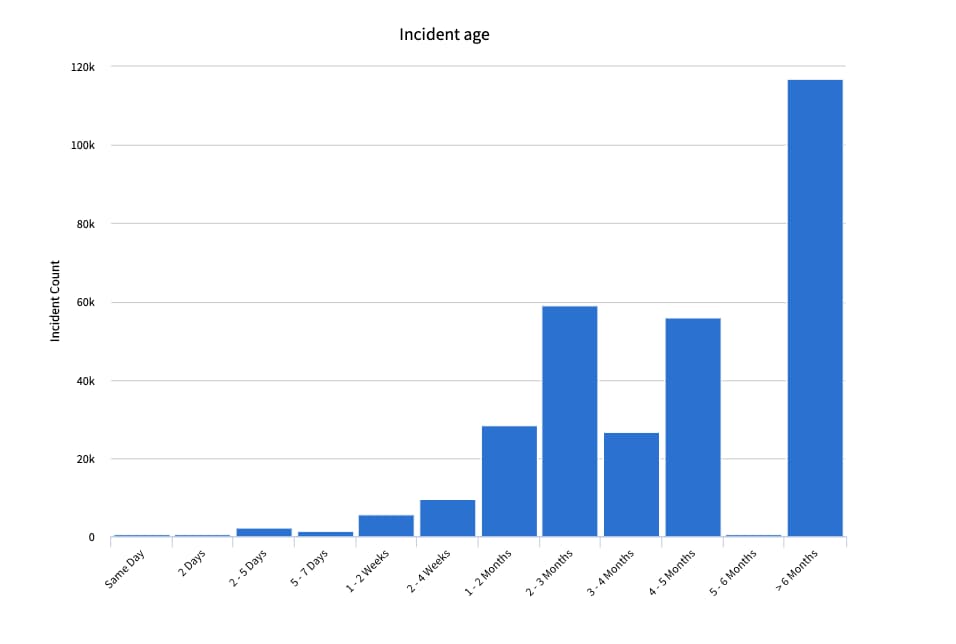
How can I create a report that uses a vertical bar graph stacked by date in the following format: 1st bar 1 - 7 days ago. 2nd bar 8 - 14 days ago, etc.?
Solved! Go to Solution.
- Labels:
-
Multiple Versions


- Mark as New
- Bookmark
- Subscribe
- Mute
- Subscribe to RSS Feed
- Permalink
- Report Inappropriate Content
10-08-2020 01:18 PM
I dont think you can stacked by a date field unless you create an aging field in your table.
But if you group by the date field, you can get the aging report like below.

- Mark as New
- Bookmark
- Subscribe
- Mute
- Subscribe to RSS Feed
- Permalink
- Report Inappropriate Content
10-08-2020 01:18 PM
- Mark as New
- Bookmark
- Subscribe
- Mute
- Subscribe to RSS Feed
- Permalink
- Report Inappropriate Content
01-27-2021 10:35 AM
Hi Sanjiv -
Would you be willing to send me your configuration setup for this report?
- Mark as New
- Bookmark
- Subscribe
- Mute
- Subscribe to RSS Feed
- Permalink
- Report Inappropriate Content
10-08-2020 01:20 PM
Thank you! That is perfect!
- Mark as New
- Bookmark
- Subscribe
- Mute
- Subscribe to RSS Feed
- Permalink
- Report Inappropriate Content
10-08-2020 01:25 PM
Awesome... Please mark my response correct if it answered your question.
