Breakdown on metric assessment definition
- Mark as New
- Bookmark
- Subscribe
- Mute
- Subscribe to RSS Feed
- Permalink
- Report Inappropriate Content
07-24-2025 08:07 AM
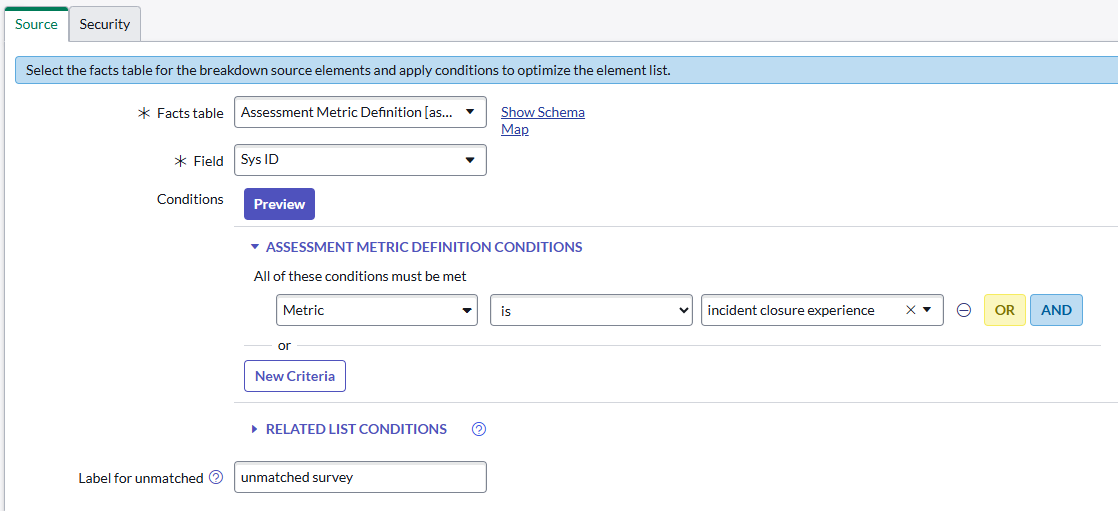
When we Close an Incident, we send out a survey/assessment to the user. It has two parts, a question with a Satisfied/Dissatisfied result and a comment box/field. I would like to create a Breakdown based on the Satisfied/Dissatisfied result to use in an Indicator. I have tried following previous guidance attempting to use the ‘assessment metric definition’ table as the source and map it to the result table. I have yet to get any matches in results in various attempts. Attached are pictures of my settings, any guidance would be appreciated.
- Mark as New
- Bookmark
- Subscribe
- Mute
- Subscribe to RSS Feed
- Permalink
- Report Inappropriate Content
07-24-2025 12:00 PM
Hi @Paul Kraus ,
Great — you're close to having this set up correctly. What you're seeing is a common issue with Breakdown Mappings when working with the asmt_metric_result table in Performance Analytics (PA).
What’s Working
You created an Indicator sourced from asmt_metric_result.
You created a Breakdown Source using the Metric Definition field.
You mapped that Breakdown to the Indicator using the same table and field.
The Indicator is showing correct results, broken down by Metric Definition.
The Problem:
Your Breakdown Mapping list shows thousands of rows, not just the two actual breakdowns you expect.
This is likely because:
The Breakdown Mapping table (pa_m2m_indicator_breakdown) stores every Indicator Source record joined to each Breakdown value — not just the distinct combinations you’d logically expect.
asmt_metric_result contains many rows per metric definition (one per user/response), so the mapping pulls one row per source record, even if they share the same breakdown value.
Why This Happens:
Breakdown Mapping doesn’t aggregate — it mirrors the raw data, meaning if 10,000 results have Metric Definition = “Customer Satisfaction,” it maps that same breakdown value 10,000 times.
You only see 2 results in the Indicator visualization because:
The Breakdown report is aggregating (i.e., grouping by Breakdown value).
But the underlying mapping isn’t aggregated — it’s just a mirror of all raw mappings.
What You Can Do
If your Indicator visualization and Breakdown widget are correct, this behavior in the Breakdown Mapping table is normal and harmless.
If performance becomes an issue:
Use an Indicator Source with aggregation, like grouping asmt_metric_result by metric_definition and assessment_date, with a COUNT() or AVG(score) as needed.
This will reduce rows and speed up mappings.
3. Use a custom Breakdown Source
Instead of using asmt_metric_result.metric_definition directly, create a Breakdown Source that:
Pulls only distinct metric definitions (e.g., via a simple table like asmt_metric).
Then write a custom script in the Breakdown Mapping to map the correct rows.
But in most cases, this isn’t necessary unless performance suffers.
Step 1: Create an Indicator Source
Instead of pulling all rows from asmt_metric_result, create a Performance Analytics Indicator Source that groups and aggregates.
Go to: Performance Analytics > Sources > Indicator Sources
Create New:
Field Value
Name Aggregated Assessment Results
Table asmt_metric_result
Aggregation Count (or Average(score) if applicable)
Group By metric_definition, sys_created_on (or assessment.date)
Conditions Add if needed to filter active metrics, time frames, etc.
This gives you one row per metric per day — vastly fewer rows.
Step 2: Use This as Your Indicator Source
When creating your Indicator:
Data Source: Use the aggregated Indicator Source above.
Unit: Count or Average depending on your aggregation.
Frequency: Daily (or Weekly/Monthly as fits your reporting).
Breakdown: metric_definition
This way, your Indicator is pulling from a pre-aggregated table, and you’ll only see one mapping per metric per day — not thousands.
Step 3: Breakdown Source and Mapping
You’ve already set up a Breakdown on metric_definition. To clean that up:
A. Breakdown Source
Create or reuse a Breakdown Source where:
Table = asmt_metric
Field = name (or whatever distinguishes your metrics)
This ensures you’re only breaking down by valid metric definitions, not every single result row.
B. Breakdown Mapping
Map using:
Indicator Source Table: your new asmt_metric_result aggregated source
Breakdown field: metric_definition
Now each row maps one metric per day to a breakdown — clean and efficient.
You can use Scripted Breakdown Mapping also:
If needed, you can script the mapping to filter only distinct or relevant combinations, like this:
javascript
Copy
Edit
(function map(sourceRecord) {
var value = sourceRecord.metric_definition;
if (!value) return [];
return [{
breakdown_value: value.toString()
}];
})
Please mark 👍 if it's helpfull or accept solution.
Thank you
- Mark as New
- Bookmark
- Subscribe
- Mute
- Subscribe to RSS Feed
- Permalink
- Report Inappropriate Content
07-24-2025 12:44 PM
This is great but question on your Step 1. For an Indicator or Indicator Source, there is no place for a "group by" function. An Indicator has Count Distinct if that is what you mean.
- Mark as New
- Bookmark
- Subscribe
- Mute
- Subscribe to RSS Feed
- Permalink
- Report Inappropriate Content
07-25-2025 10:15 AM
Hi @Paul Kraus ,
You're absolutely right:
In Performance Analytics, when creating an Indicator or Indicator Source, there is no explicit Group By function.
So if I mentioned a "group by" in Step 1, I should clarify what I meant — especially in the context of building an Indicator or Indicator Source:
Indicator Source:
This defines the table and the conditions from which your data is pulled.
You can define filters here, but not groupings.
Aggregation methods supported include:
- Count
- Count Distinct
- Sum
- Average
- Minimum / Maximum
Indicator:
Built on top of the Indicator Source.
Allows you to apply a count method, such as:
- Count
- Count Disctinct
- Sum
You can also define Breakdowns here (this is where your “grouping” actually happens — more on that below).
So, if you're asking about "group by"...
In ServiceNow Performance Analytics, the closest equivalent to Group By is:
Breakdowns
Breakdowns let you view the Indicator values segmented by fields such as:
Assignment group, Category,Priority,Created by etc.
For example:
An indicator counting incidents per day can have a breakdown by Assignment Group.
That gives you grouped values for each Assignment Group, but the grouping is applied after the data is collected — not during the Indicator Source definition.
Please mark it hlepfull if it help you or accept soulution.
Thank you
- Mark as New
- Bookmark
- Subscribe
- Mute
- Subscribe to RSS Feed
- Permalink
- Report Inappropriate Content
07-24-2025 10:57 AM
Hi @indrajeetma ,
Here are the key tables involved:Here are the key tables involved:
Tables:
asmt_assessment_instance: One instance of a survey/assessment sent to a user.
asmt_metric_result: Stores answers to each question in the assessment.
asmt_metric: The definition of the question being asked.
asmt_metric_type: Data type of the answer (choice, text, numeric, etc.)
asmt_choice: Stores the actual possible choices for multiple choice (e.g., Satisfied/Dissatisfied).
You likely want to break down results by the value (e.g., "Satisfied", "Dissatisfied") recorded in the asmt_metric_result table, specifically from the choice-type question.
Step-by-Step: Creating a Breakdown
1. Create a Breakdown Source
Go to Performance Analytics > Breakdowns > Breakdown Sources, then:
Name: Satisfaction Result
Source type: Table
Table: asmt_metric_result
Label field: display_value or string_value
This will show "Satisfied" or "Dissatisfied" as labels.
Filter: Limit to just your satisfaction question if needed:
metric.name is "Satisfaction"
You can also filter by the metric ID instead of name for accuracy:
metric = [your satisfaction question sys_id]
2. Create a Breakdown
Go to Performance Analytics > Breakdowns > Create New
Name: Satisfaction Status
Breakdown source: Satisfaction Result (what you created above)
Label field: display_value (this is what shows to the user — e.g., Satisfied)
You now have a breakdown that maps to satisfaction values.
3. Create or Modify Your Indicator Source
The indicator source should also be asmt_metric_result (or a scripted one if needed). Use a filter such as:
metric.name is "Satisfaction"
If you're tying this back to Incident, you can include a reference from asmt_metric_result -> assessment_instance -> target_id, assuming the survey is linked to an Incident.
4. Add the Breakdown to the Indicator
In the Indicators module:
Go to your indicator.
Under Breakdowns, add your Satisfaction Status breakdown.
Troubleshooting Tips
If you are seeing no results:
No matches Double-check the metric.name matches exactly or use metric sys_id
display_value is empty Check if you're using a numeric value instead — you may need to use integer_value instead of display_value
Breakdown not working Verify the question uses a choice-type metric, not free-text
No results in widget Check date ranges and whether the data actually exists in that timeframe
Use a Scripted Breakdown Source
If you're having difficulty filtering or mapping data cleanly, a scripted breakdown source lets do it in script:
(function() {
var result = [];
var gr = new GlideRecord('asmt_metric_result');
gr.addQuery('metric.name', 'Satisfaction');
gr.query();
while (gr.next()) {
result.push({
name: gr.display_value + '',
sys_id: gr.sys_id + ''
});
}
return result;
})();
Please mark👍 if it's helpfull or accept solution.
Thank you