Custom Reports - on a date field
- Mark as New
- Bookmark
- Subscribe
- Mute
- Subscribe to RSS Feed
- Permalink
- Report Inappropriate Content
06-16-2022 11:37 AM
Hi all!
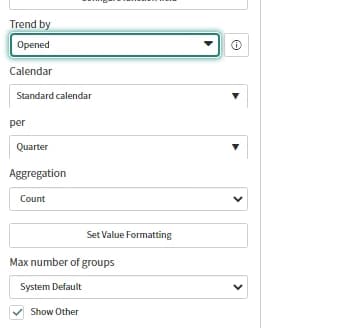
Trying to create a report with Trend by a 'date field' (example: opened) on X-axis filtered for an 'Year' or a 'Quarter'.
Need to configure further buckets per each month '1-10 days, 11-20 days, 21-31 days' to Show January '1-10 days, 11-20 days, 21-31 days' and February 1-10 days, 11-20 days, 21-31 days', so on...
Anyone has done this? Is this a possibility and if yes, how was it accomplished?
Any leads will be appreciated. TIA.

- Labels:
-
Dashboard
-
Performance Analytics
-
Reporting
- Mark as New
- Bookmark
- Subscribe
- Mute
- Subscribe to RSS Feed
- Permalink
- Report Inappropriate Content
06-17-2022 12:25 AM
Hello,
I think this can be achieved by range report. Please find below reference -
2) https://community.servicenow.com/community?id=community_blog&sys_id=b11e226ddbd0dbc01dcaf3231f961988
Please mark reply as Helpful/Correct, if applicable. Thanks!
Regards,
Akshay
- Mark as New
- Bookmark
- Subscribe
- Mute
- Subscribe to RSS Feed
- Permalink
- Report Inappropriate Content
06-17-2022 11:55 AM
Akshay! Thanks for looking into it. However, this is not serving the purpose according to my actual requirement.
I explored ranges and am able to separate data on y axis like 1-10 days, 11-20 days, 21 to 31 days.. so on. But this gives the day range relative to today. so after 31 days, it goes by month to month.

What my requirement is that I need to split in to the date ranges (not day ranges) per calendar month like Jan 1-10 days, Jan 20-21 days, jan 21-31 days, and similarly for each month in this calendar year data.
I am able to do weekly which is default 'per week' , but not 1-10 days for each month.
Thanks,
Ravitx