How do I create a report that shows an Incident Backlog for the last e.g. 6 months?
- Mark as New
- Bookmark
- Subscribe
- Mute
- Subscribe to RSS Feed
- Permalink
- Report Inappropriate Content
02-16-2021 07:36 AM
Hello,
I am trying to show a backlog of incidents in one of our assignment groups over a set period of time.
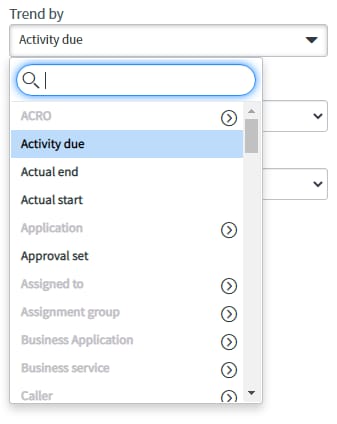
When I create a report, I want to 'Trend By': Active, as this will show many incidents were active on each date.
However this is not an option for Trend By (see photo).

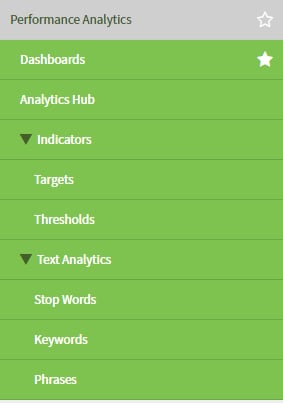
I need to see all the incidents that were New, In Progress or On Hold each day but can't seem to find a way of doing it. There is a Performance Analytics tab but I think it is limited to a small number of features, as I cannot access Indicators (see second photo).

Any help would be greatly appreciated! Thank you!
- Labels:
-
Performance Analytics
-
Reporting
- Mark as New
- Bookmark
- Subscribe
- Mute
- Subscribe to RSS Feed
- Permalink
- Report Inappropriate Content
02-16-2021 07:48 AM
Hi Russell,
You can only trendy by a time/date field I believe (basically the date or time field you want to display over time, i.e created by).
What you want to do (show how many X of something are per day) can't be done with a report. If you have Performance Analytics I believe you can do this with indicators, otherwise you could create a metric that stores the number of active tickets per day.
(Basically you can't report on this because it's historical data that isn't stored)
- Mark as New
- Bookmark
- Subscribe
- Mute
- Subscribe to RSS Feed
- Permalink
- Report Inappropriate Content
02-16-2021 08:17 AM
Thank you Rhodri for your reply! I am unable to see Metric in the Filter Navigator. Is this something that might be missing from my company's servicenow?
- Mark as New
- Bookmark
- Subscribe
- Mute
- Subscribe to RSS Feed
- Permalink
- Report Inappropriate Content
02-16-2021 08:39 AM
https://docs.servicenow.com/bundle/paris-platform-administration/page/use/reporting/concept/c_MetricDefinitionSupport.html
No problem! I'm not 100% sure if it's ITSM specific, but according to the docs there is a plugin that has to be enabled.
This is it in a personal dev instance available through ServiceNow Developer:

Metrics are meant for capturing a value or duration at a given trigger, but you can insert metrics via a business rule or scheduled job. (i.e to count/sum up something once a day and insert the value in a metric).
The tables are metric_instance and metric_definition I believe.
- Mark as New
- Bookmark
- Subscribe
- Mute
- Subscribe to RSS Feed
- Permalink
- Report Inappropriate Content
02-17-2021 03:56 AM
getStateCount();

function getStateCount() {

    var gr = new GlideRecord('incident');
	gr.addActiveQuery();
    gr.query();
    while (gr.next()){
		insertMetric(gr.state.getDisplayValue());
	}
}

function insertMetric(type) {

	var mi = new GlideRecord('metric_instance');
	var metricSysID = ''; //sysID of your metric definition
	mi.initialize();
	mi.definition = metricSysID;
	mi.field = 'incident_state';
	mi.field_value = type;
	mi.insert();
}
Here's an example of a script which could be used in a scheduled job, you would then report on the count of these and trend by the created date. (this would create one metric per incident record).
On metrics field_value and value are string fields so you cannot "sum" by them, if you create a new field on metric instance as I have done "integer_value" which takes the value field and maps it in if integer, you could create 1 metric per day per state and report on those (storing the total of all incidents in each state).