How do I create a stacked column report in performance analytics
- Mark as New
- Bookmark
- Subscribe
- Mute
- Subscribe to RSS Feed
- Permalink
- Report Inappropriate Content
04-14-2017 07:25 AM
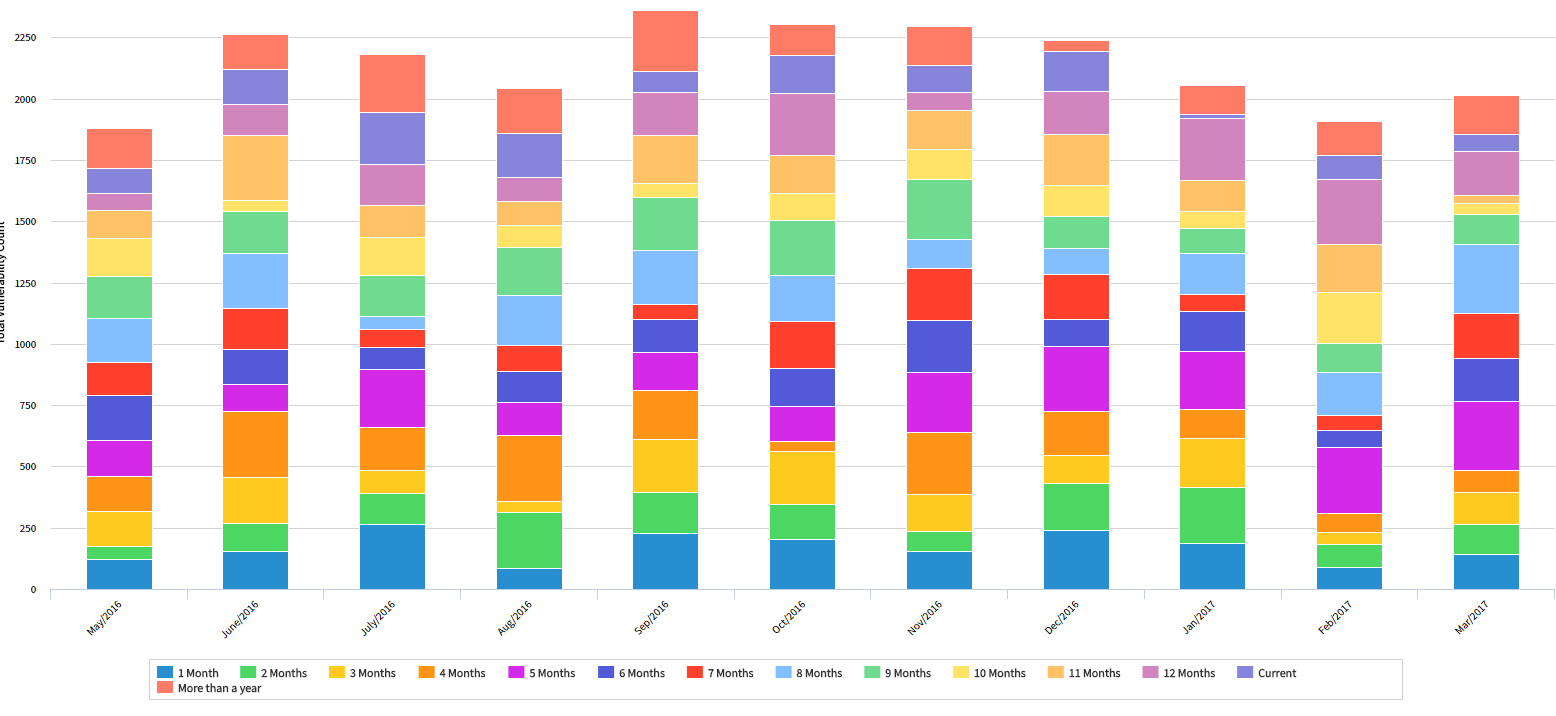
I'm specifically trying to work with the Vulnerable Item table but I think the concept would be fine either way. I've written a script, table and report that can take a snapshot of that table to give me the number of vulnerabilities and stack them based on how many months overdue they are. It runs at the beginning of the month and stores the aggregate data in my own table that I can easily report off of. I'd like to use Performance Analytics directly against the Vulnerable Item table to do the same.
I've created indicators, breakdowns and their sources but can't seem to break the data down properly to get a stacked column for the current snapshot in time. Can someone help me figure out how to build this thing? Not looking for historical or trend data right now, just how to get the current snapshot to stack on any field so I can figure out the script to stack it on months overdue.
Good report:

PA Report:

Thanks
Dan
- Labels:
-
Performance Analytics
-
Reporting
- Mark as New
- Bookmark
- Subscribe
- Mute
- Subscribe to RSS Feed
- Permalink
- Report Inappropriate Content
09-25-2024 12:50 AM
like the same way i want stack by assignment group and breakdown by serviceofferings.