- Mark as New
- Bookmark
- Subscribe
- Mute
- Subscribe to RSS Feed
- Permalink
- Report Inappropriate Content
09-15-2022 01:18 PM
Hi all,
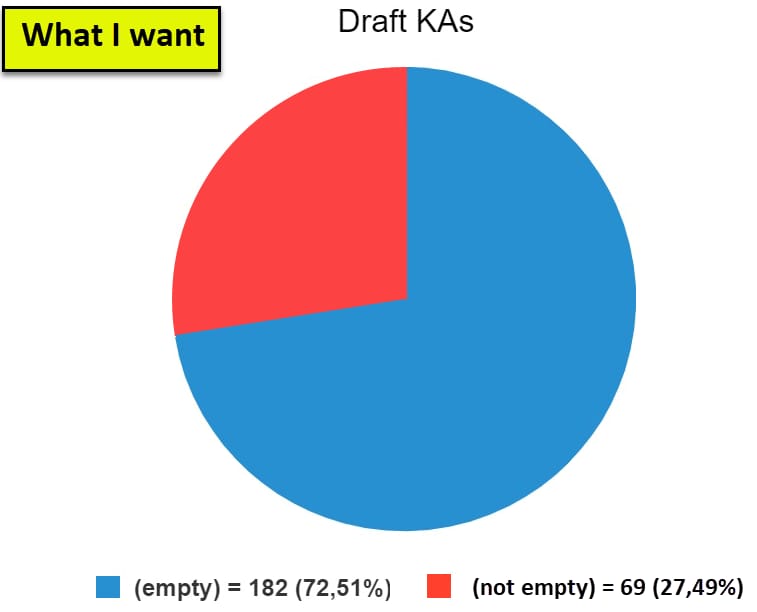
I need to create a pie chart, based on Knowledge Articles (table kb_knowledge) that are in the Draft workflow. Some of these KAs have been created based on an incident, others are created from scratch.
- If a KA is created based on an incident, the INC number is recorded in a field named Source Task.
- If a KA is created from scratch, the Source Task field is empty.
I can create the chart, grouping by the Source Task field. However, it of course shows a "slice" for every INC number, instead of the "empty/not empty" that I want. Does anyone know how to do this? Many thanks in advance /Tommy


Solved! Go to Solution.
- Labels:
-
Multiple Versions
-
Reporting
- Mark as New
- Bookmark
- Subscribe
- Mute
- Subscribe to RSS Feed
- Permalink
- Report Inappropriate Content
09-15-2022 01:46 PM
Hi,
Try to group it by "Source Task.Task Type". That way it will show empty and incident as two options.
Note that it will display additional options in case knowledge articles are created from other classes too (like problem).
Thanks,
Arav
- Mark as New
- Bookmark
- Subscribe
- Mute
- Subscribe to RSS Feed
- Permalink
- Report Inappropriate Content
09-16-2022 07:49 AM

- Mark as New
- Bookmark
- Subscribe
- Mute
- Subscribe to RSS Feed
- Permalink
- Report Inappropriate Content
09-16-2022 08:52 AM
Glad that it worked 🙂