- Mark as New
- Bookmark
- Subscribe
- Mute
- Subscribe to RSS Feed
- Permalink
- Report Inappropriate Content
04-12-2016 06:57 AM
Hello everyone!
I want to create an indicator to show the number of active problems monthly.
I am not sure if is it ok to use Monthly frequency and Daily Data Collector Job? Or should I create a Data Collector Job and scheduled it to run monthly?
Thank you in advance!
Oana
Solved! Go to Solution.
- Labels:
-
Performance Analytics
- Mark as New
- Bookmark
- Subscribe
- Mute
- Subscribe to RSS Feed
- Permalink
- Report Inappropriate Content
04-12-2016 02:00 PM
Oana,
I assume that with 'an indicator to show the number of active problems monthly' you are looking for the number of not-closed problems at the end of the month. If so, you can use two approaches.
But first of all, try to use conditions that are not based on states but on dates (active = true is based on states). This will allow you to collect accurate historic scores values as well. So whenever you need to recollect scores, the indicator (source) is set up correctly.
First approach: your indicator source should look like:

The 'Today' in the conditions above are placeholder for real dates. The real dates are put in when the scores collection runs.
Set up your scores collection job like:
![[PA Problem] Monthly Data Collection _ ServiceNow 2016-04-12 22-27-30.png](/community/image/serverpage/image-id/125642iF75D253C7E7F90E4/image-size/large?v=v2&px=999 "[PA Problem] Monthly Data Collection _ ServiceNow 2016-04-12 22-27-30.png")
ad1: run your collection on a monthly schedule on the first day of the (next) month. (With above settings, it must be on the 1st day of the month)
ad2: set your collection parameters to go back 1 day: so if you run this on April 1, the Today in the indicator source conditions gets replaced by real dates and reads like (simplified):
Opened on March 31 OR
Opened before March 31
AND
Closed is empty OR
Closed after March 31
If wanted you could use the same indicator source also in weekly or daily collections. It requires separate weekly and daily jobs with different Job parameters (weekly/daily) but with the same Collection parameters
Second approach: you can also set up a different indicator source like:

Now your scores collection job should look like:
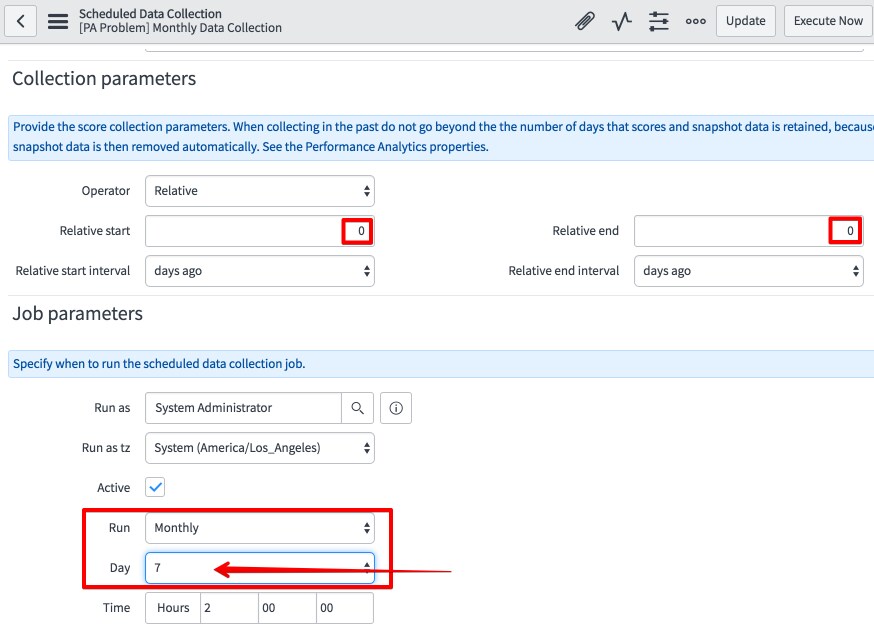
![[PA Problem] Monthly Data Collection _ ServiceNow 2016-04-12 22-46-24.png](/community/image/serverpage/image-id/125641iE0373E042BB6B0B7/image-size/large?v=v2&px=999 "[PA Problem] Monthly Data Collection _ ServiceNow 2016-04-12 22-46-24.png")
So in the Collection parameters set the relative start and end to 0, meaning today.
Now on the Job parameters you can run this on any day of the month, if you use dates in your conditions! *
Of course, this indicator source is only fit to be used in monthly collections!
*if you use states and you run the scores collection job on the 7th of the month, than problems that are set to not-active on the 1st - 6th day of the month are not included in your score, but they should be.
Hope this helps.
Cheers, Pieter
- Mark as New
- Bookmark
- Subscribe
- Mute
- Subscribe to RSS Feed
- Permalink
- Report Inappropriate Content
04-12-2016 02:00 PM
Oana,
I assume that with 'an indicator to show the number of active problems monthly' you are looking for the number of not-closed problems at the end of the month. If so, you can use two approaches.
But first of all, try to use conditions that are not based on states but on dates (active = true is based on states). This will allow you to collect accurate historic scores values as well. So whenever you need to recollect scores, the indicator (source) is set up correctly.
First approach: your indicator source should look like:
The 'Today' in the conditions above are placeholder for real dates. The real dates are put in when the scores collection runs.
Set up your scores collection job like:
ad1: run your collection on a monthly schedule on the first day of the (next) month. (With above settings, it must be on the 1st day of the month)
ad2: set your collection parameters to go back 1 day: so if you run this on April 1, the Today in the indicator source conditions gets replaced by real dates and reads like (simplified):
Opened on March 31 OR
Opened before March 31
AND
Closed is empty OR
Closed after March 31
If wanted you could use the same indicator source also in weekly or daily collections. It requires separate weekly and daily jobs with different Job parameters (weekly/daily) but with the same Collection parameters
Second approach: you can also set up a different indicator source like:
Now your scores collection job should look like:
So in the Collection parameters set the relative start and end to 0, meaning today.
Now on the Job parameters you can run this on any day of the month, if you use dates in your conditions! *
Of course, this indicator source is only fit to be used in monthly collections!
*if you use states and you run the scores collection job on the 7th of the month, than problems that are set to not-active on the 1st - 6th day of the month are not included in your score, but they should be.
Hope this helps.
Cheers, Pieter
- Mark as New
- Bookmark
- Subscribe
- Mute
- Subscribe to RSS Feed
- Permalink
- Report Inappropriate Content
04-13-2016 12:37 AM
Thank you so much, Pieter!
One of my option was the first one you described, but I was not sure if it is necessary to create a Monthly Data Collector Job. I thought I could just use some conditions inside the indicator, with the frequency Monthly and a Daily Data Collector Job.
Thank you again. Have a nice day!
Oana
- Mark as New
- Bookmark
- Subscribe
- Mute
- Subscribe to RSS Feed
- Permalink
- Report Inappropriate Content
07-17-2017 03:57 AM
Peter, I see what you are doing here - BUT - going on a stage, how do you PRESENT these monthly scores on a scorecard / widget?
The scores get recorded against the day that you run the collection (eg in scenario 2 not necessarily the first of the month)
The time-series options do not include "Monthly"
Can you present these scores meaningfully?
- Mark as New
- Bookmark
- Subscribe
- Mute
- Subscribe to RSS Feed
- Permalink
- Report Inappropriate Content
08-29-2018 02:03 AM
I agree with Mike - won't the second method put the data in the wrong month? Representing July's data in August etc.
I have a similar problem, trying to represent the status of open incidents on the last day of the month. This method collects the right data, but the presentation is not right.