- Mark as New
- Bookmark
- Subscribe
- Mute
- Subscribe to RSS Feed
- Permalink
- Report Inappropriate Content
07-09-2025 04:50 AM - edited 07-09-2025 04:52 AM
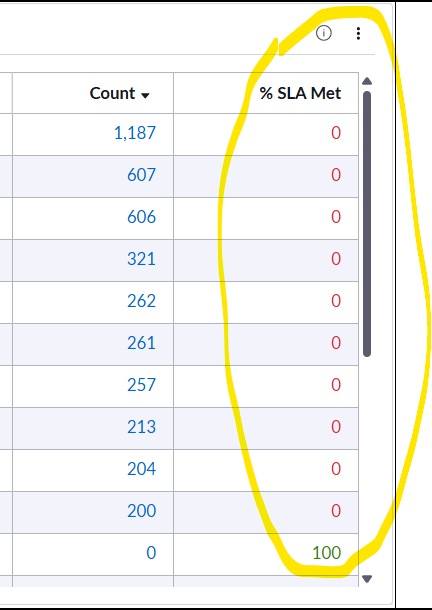
Since upgrade, I'm having an issue (see attachment) where the % SLA Met column shows zeros, until doing the following temporary workaround (but after saving/refreshing the issue re-occurs):
Temporary workaround: This has to be done each time the dashboard refreshes -- edit configuration (see attachment) > group by > select 'sla definition (row) > change 'number of groups based on' to 'individual metric' > apply > revert back to 'first metric' > apply (see 'temp fix' attachment)
Appreciate any tips or guidance that may assist. Thanks!
Solved! Go to Solution.
- Mark as New
- Bookmark
- Subscribe
- Mute
- Subscribe to RSS Feed
- Permalink
- Report Inappropriate Content
02-04-2026 07:06 AM
In case others come across this issue, it is apparently a "known defect" in Zurich (at least as of today)---that when the 'Row' or 'Column' is showing anything other than 'Show All'. In otherwards 'top 5..10..etc' do not work properly (at least when several 'Metric' tables are added).
- Mark as New
- Bookmark
- Subscribe
- Mute
- Subscribe to RSS Feed
- Permalink
- Report Inappropriate Content
07-10-2025 09:59 AM
Hi @MG25 did you check if there was any customization and that got missed during upgrade?
Regards,
Prasanna
- Mark as New
- Bookmark
- Subscribe
- Mute
- Subscribe to RSS Feed
- Permalink
- Report Inappropriate Content
08-27-2025 11:29 AM
It is definitely not a customization. I have seen this happening with several clients now, and this happens both to migrated and newly created pivot tables.
Those pivot tables also often link to the wrong filters when clicking the numbers in it. Usually the error does not happen when you just configure or create the pivot but rather after reloading the dashboard.
It gets even worse with ones created with indicators as data sources.
- Mark as New
- Bookmark
- Subscribe
- Mute
- Subscribe to RSS Feed
- Permalink
- Report Inappropriate Content
07-10-2025 10:03 AM
Meanwhile please make it as individual matrix and check
Regards,
Prasanna
- Mark as New
- Bookmark
- Subscribe
- Mute
- Subscribe to RSS Feed
- Permalink
- Report Inappropriate Content
07-10-2025 10:25 AM
Appreciate the suggestions.. I'll have to check with the developers re: customization. Trying the individual matrix was inconclusive; it shows correctly but it also doesn't have the option to change 'number of groups based on' to 'individual metric' or 'first metric'.
If useful, I attached the formula view of the indicator. Note, the additional metric field (count) I added to the matrix is also used in this indicator -- 'Number of closed Requested Items SLAs (Monthly)'