- Mark as New
- Bookmark
- Subscribe
- Mute
- Subscribe to RSS Feed
- Permalink
- Report Inappropriate Content
07-09-2025 04:50 AM - edited 07-09-2025 04:52 AM
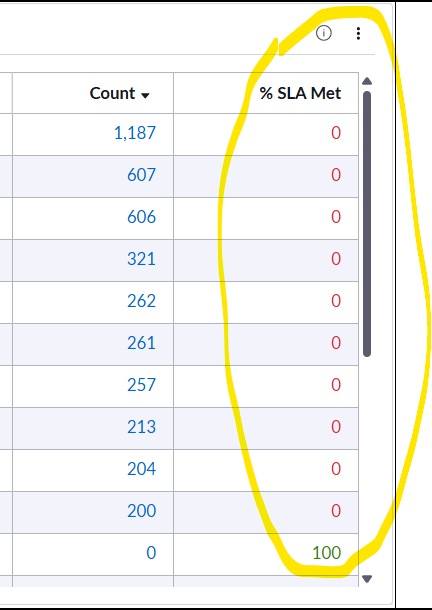
Since upgrade, I'm having an issue (see attachment) where the % SLA Met column shows zeros, until doing the following temporary workaround (but after saving/refreshing the issue re-occurs):
Temporary workaround: This has to be done each time the dashboard refreshes -- edit configuration (see attachment) > group by > select 'sla definition (row) > change 'number of groups based on' to 'individual metric' > apply > revert back to 'first metric' > apply (see 'temp fix' attachment)
Appreciate any tips or guidance that may assist. Thanks!
Solved! Go to Solution.
- Mark as New
- Bookmark
- Subscribe
- Mute
- Subscribe to RSS Feed
- Permalink
- Report Inappropriate Content
02-04-2026 07:06 AM
In case others come across this issue, it is apparently a "known defect" in Zurich (at least as of today)---that when the 'Row' or 'Column' is showing anything other than 'Show All'. In otherwards 'top 5..10..etc' do not work properly (at least when several 'Metric' tables are added).
- Mark as New
- Bookmark
- Subscribe
- Mute
- Subscribe to RSS Feed
- Permalink
- Report Inappropriate Content
08-12-2025 09:17 AM
Appreciate any other thoughts/suggestions.. the workaround has to be done upon every page refresh.
- Mark as New
- Bookmark
- Subscribe
- Mute
- Subscribe to RSS Feed
- Permalink
- Report Inappropriate Content
09-14-2025 11:34 PM
were you able to fix it ?
currently facing the same issue on yokohama-patch7
- Mark as New
- Bookmark
- Subscribe
- Mute
- Subscribe to RSS Feed
- Permalink
- Report Inappropriate Content
09-15-2025 07:30 AM
Unfortunately not. We have a hiwave case open and so far they've suggested updating the following plugins (but it did not resolve the issue):
Data Visualization: sn_par_vis_base
Platform Analytics sn_app_analytics_w
- Mark as New
- Bookmark
- Subscribe
- Mute
- Subscribe to RSS Feed
- Permalink
- Report Inappropriate Content
09-15-2025 09:31 AM - edited 09-15-2025 09:31 AM
Do you have the Platform Analytics plugin updated to the latest version? 90% of the Platform Analytics issues I encounter are usually fixed by this.
If not, without knowing more about your environment, I would suggest opening a HI case to ServiceNoe
- Mark as New
- Bookmark
- Subscribe
- Mute
- Subscribe to RSS Feed
- Permalink
- Report Inappropriate Content
02-04-2026 07:06 AM
In case others come across this issue, it is apparently a "known defect" in Zurich (at least as of today)---that when the 'Row' or 'Column' is showing anything other than 'Show All'. In otherwards 'top 5..10..etc' do not work properly (at least when several 'Metric' tables are added).