Performance Analytics Multiple Breakdowns on a Breakdown Widget
- Mark as New
- Bookmark
- Subscribe
- Mute
- Subscribe to RSS Feed
- Permalink
- Report Inappropriate Content
03-31-2020 11:04 PM
Hi There,
I'm currently creating a Dashboard and want all reports to be PA reports as the data source is a DB view. Using normal reports causes the performance of the Dashboard to be too slow, so it needs to be a PA report.
I currently have a breakdown widget which shows the number of vulnerabilities by Business Application. I need to break it down again to show number of vulnerabilities by Business Application by Criticality. I can normally add the second breakdown in a normal report by using the 'Stack By' function - does anyone know what the equivalent is in PA?

- Mark as New
- Bookmark
- Subscribe
- Mute
- Subscribe to RSS Feed
- Permalink
- Report Inappropriate Content
04-01-2020 12:30 AM
Hi Nicole,
As per my understanding, you can use stacked by column as critically in your report and add that report in the PA widget on dashboard or else in PA you can create first level breakdown as Business application to show on the widget and second level breakdown as criticality.If any concerns please let me know.
Regards,
Apurva
- Mark as New
- Bookmark
- Subscribe
- Mute
- Subscribe to RSS Feed
- Permalink
- Report Inappropriate Content
04-01-2020 12:55 AM
Hi Apurva,
Thank you so much for the quick response! I can't use a standard report widget because it takes too long to load and makes the Dashboard performance too slow. Can you please describe how I create the first level breakdown for Business Application and second level breakdown for criticality on a PA report? Sorry I've tried everything and I can't seem to get it to work.
- Mark as New
- Bookmark
- Subscribe
- Mute
- Subscribe to RSS Feed
- Permalink
- Report Inappropriate Content
04-02-2020 12:04 AM
Hi Nicole,
For doing this task using PA reporting you need to create 2 different breakdowns which you need like Business application and Criticality. After that you need to create the PA widget of type as Breakdown and visualization type can be Column/Stacked column in this case.While creating widget select the breakdown field as your first breakdown and then select 2nd breakdown as Criticality.And then add this PA widget on any dashboard you want to.Other way is you can open the the data by clicking on the widget there you will see breakdown section under that you can see other breakdowns as well for your data. Just try this once.If any concerns, please let me know.
Regards,
Apurva
- Mark as New
- Bookmark
- Subscribe
- Mute
- Subscribe to RSS Feed
- Permalink
- Report Inappropriate Content
04-02-2020 02:33 AM
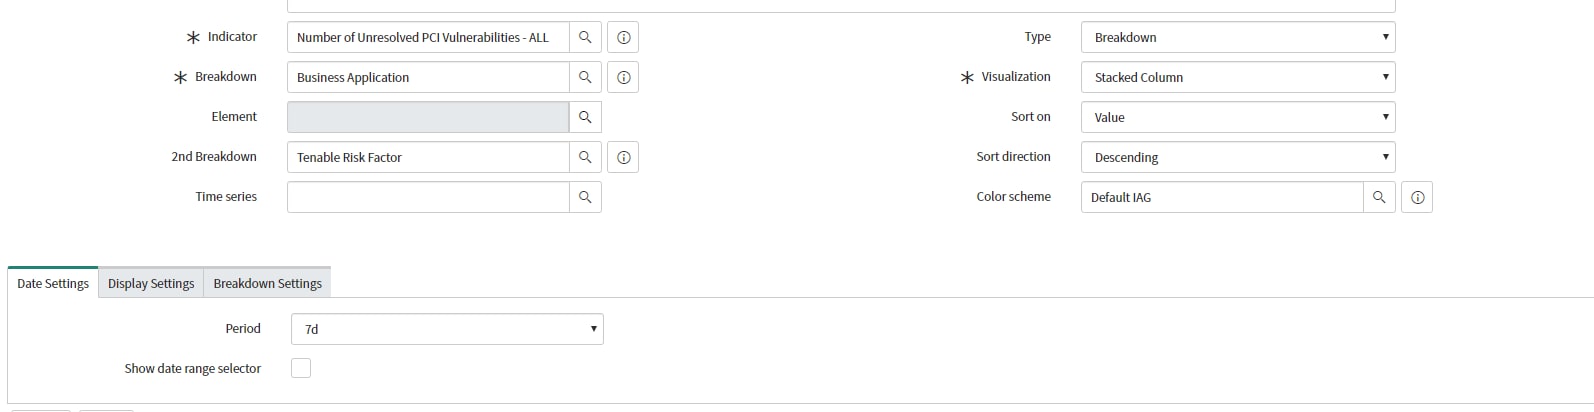
Thanks Apurva! So I tried what you suggested and this is what happens:

This is what the widget configuration looks like:

I can confirm the breakdowns are definitely working because if I create the same widget with only 1 breakdown; Business Application or Criticality - they both return data. It's just when I add them both on a single widget. Also I've clicked the collect breakdown matrix on the automated indicator and confirm it's working because if I click on the widget, I can further breakdown in the analytics hub itself. But I just can't get it to work on the widget with both breakdowns.