- Mark as New
- Bookmark
- Subscribe
- Mute
- Subscribe to RSS Feed
- Permalink
- Report Inappropriate Content
04-22-2020 07:33 AM
I want to create a report which helps me to see the number of incidents created and resolved in a month
I have created a bar graph and have set correct filter dates and my assignment group.
However how do I get bars for the incident status like below:

Solved! Go to Solution.
- Labels:
-
Reporting
- Mark as New
- Bookmark
- Subscribe
- Mute
- Subscribe to RSS Feed
- Permalink
- Report Inappropriate Content
04-23-2020 05:32 AM
Hi Subh,
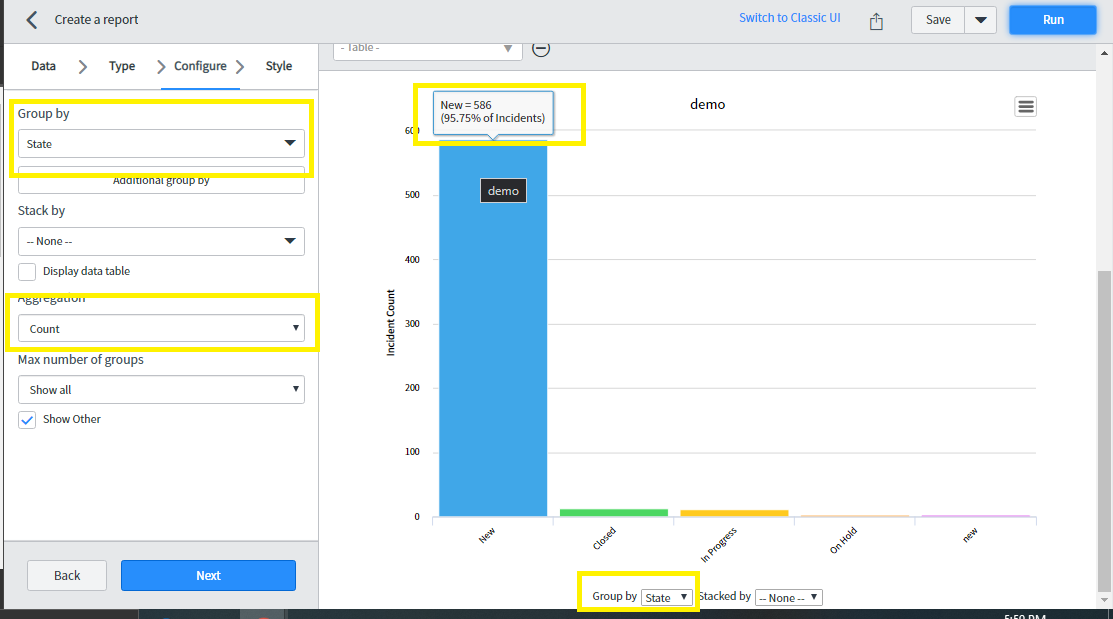
Change the group by Field to state that will filter the records based on the state.
once the report generated you can just put the mouse pointer to the top of the bar that will show the count.
Make changes as shown in below image.

Mark helpful or correct based on impact.
Regards,
Priyanka A.
- Mark as New
- Bookmark
- Subscribe
- Mute
- Subscribe to RSS Feed
- Permalink
- Report Inappropriate Content
04-26-2020 10:23 PM
Thank you so much for your help.
Regards
Subh
- Mark as New
- Bookmark
- Subscribe
- Mute
- Subscribe to RSS Feed
- Permalink
- Report Inappropriate Content
08-31-2020 04:54 AM
We have an existing article that might help you, in case you are not aware. You can find it here!KB0836090