- Mark as New
- Bookmark
- Subscribe
- Mute
- Subscribe to RSS Feed
- Permalink
- Report Inappropriate Content
12-14-2022 03:01 PM
Coming from a previous ticketing system where the incident state totals were automatically calculated, I would like help with this feature to build a report to add to a Dashboard.
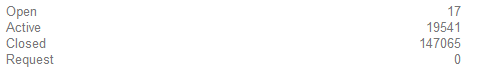
We have Client Totals based on incident state calculated as

I looked at Pivot Tables but they have the extra column that's not needed for (empty) in this case, and I would like the incident states to be in rows and their current totals to be counted.
Is this possible within ServiceNow?
Solved! Go to Solution.
- Mark as New
- Bookmark
- Subscribe
- Mute
- Subscribe to RSS Feed
- Permalink
- Report Inappropriate Content
12-16-2022 07:30 AM
I don't think that is possible.
There are some alternatives:
1. By creating a list widget you get a list of all widgets grouping by 'Incident State' and filtering

2. Creating a pivot table widget and having 'incident state' as the Row and applying the same filter.

- Mark as New
- Bookmark
- Subscribe
- Mute
- Subscribe to RSS Feed
- Permalink
- Report Inappropriate Content
12-16-2022 01:12 AM
Yes this is definitely possible by one way or another.
One quick fix I can think of is instead of using Incident State, use the 'State' field. Check if this fits your usecase. THis should not have an (empty) field.
Another way is by adding a filter like this:

This will filter out the records which have (empty) Incident State.
You can also have a bar chart with 'Display Data Table' enabled. This, will also give you a tabular as well as pictorial representation of your requirement.
- Mark as New
- Bookmark
- Subscribe
- Mute
- Subscribe to RSS Feed
- Permalink
- Report Inappropriate Content
12-16-2022 06:33 AM
This gets me closer to what I was looking for, thank you!!

How do I get the data table underneath to only show counts and not counts and percentages?

- Mark as New
- Bookmark
- Subscribe
- Mute
- Subscribe to RSS Feed
- Permalink
- Report Inappropriate Content
12-16-2022 06:55 AM
Glad to know.
If your question is answered, you can mark this answer as correct and close the thread.
- Mark as New
- Bookmark
- Subscribe
- Mute
- Subscribe to RSS Feed
- Permalink
- Report Inappropriate Content
12-16-2022 07:01 AM - edited 12-16-2022 07:19 AM
How we can hide the percentages, it's fine but unnecessary for my use case of this dashboard widget. Any help is appreciated! 🙂