- Mark as New
- Bookmark
- Subscribe
- Mute
- Subscribe to RSS Feed
- Permalink
- Report Inappropriate Content
12-14-2022 03:01 PM
Coming from a previous ticketing system where the incident state totals were automatically calculated, I would like help with this feature to build a report to add to a Dashboard.
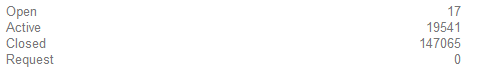
We have Client Totals based on incident state calculated as

I looked at Pivot Tables but they have the extra column that's not needed for (empty) in this case, and I would like the incident states to be in rows and their current totals to be counted.
Is this possible within ServiceNow?
Solved! Go to Solution.
- Mark as New
- Bookmark
- Subscribe
- Mute
- Subscribe to RSS Feed
- Permalink
- Report Inappropriate Content
12-16-2022 07:30 AM
I don't think that is possible.
There are some alternatives:
1. By creating a list widget you get a list of all widgets grouping by 'Incident State' and filtering

2. Creating a pivot table widget and having 'incident state' as the Row and applying the same filter.

- Mark as New
- Bookmark
- Subscribe
- Mute
- Subscribe to RSS Feed
- Permalink
- Report Inappropriate Content
12-16-2022 07:30 AM
I don't think that is possible.
There are some alternatives:
1. By creating a list widget you get a list of all widgets grouping by 'Incident State' and filtering
2. Creating a pivot table widget and having 'incident state' as the Row and applying the same filter.