- Mark as New
- Bookmark
- Subscribe
- Mute
- Subscribe to RSS Feed
- Permalink
- Report Inappropriate Content
03-07-2025 03:12 PM
Hello,
In the old legacy reports, I have a report with two data sets. One is for Interactions, where I group by "assigned to" and stack by "contact type." The other data set is for Work Items, where the group by is also "assigned to."
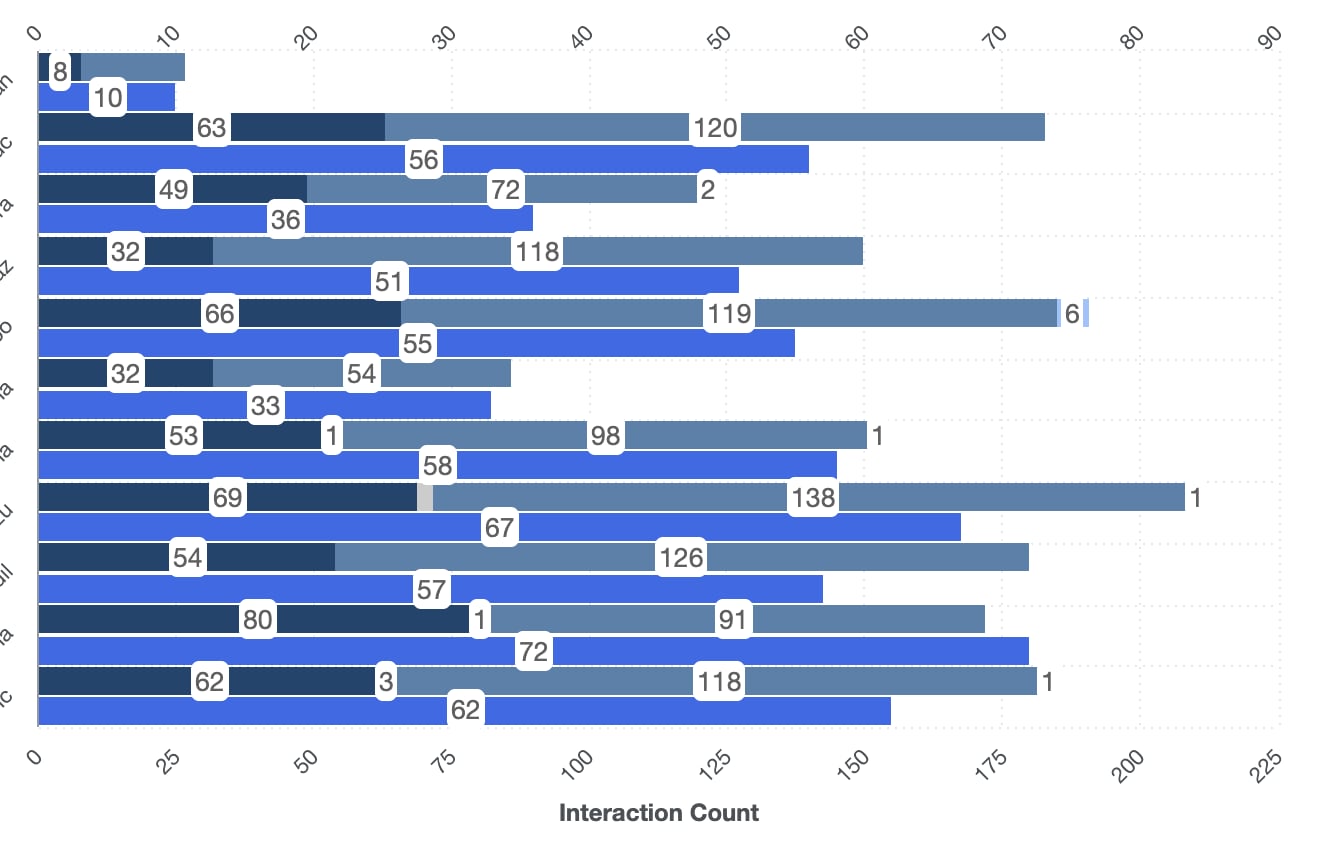
On the chart, I can see two bars for each user: one representing Interactions, grouped/stacked by contact type, and below it, a second bar showing the number of accepted work items.
I am trying to achieve the same in Platform Analytics, but when I add a chart and then two data sources, I can only see one option to group by, and I cannot find any option to add an additional group by on the bar.
If I have a chart with only one data source, I can add an additional group by. For example, on Interactions, I can group by "assigned to" and then by "contact type."
Is there any option in Platform Analytics to achieve the same result?
Solved! Go to Solution.
- Mark as New
- Bookmark
- Subscribe
- Mute
- Subscribe to RSS Feed
- Permalink
- Report Inappropriate Content
03-09-2025 06:20 AM
Hello @David Fiedler
Unfortunately that's the limitation of standard reporting. So you will need to go by the multi source breakdown as described by me in the above answer.
Please mark my answer as helpful and accept solution if it helped you in anyway.
Regards,
Shivalika
My LinkedIn - https://www.linkedin.com/in/shivalika-gupta-540346194
My youtube - https://youtube.com/playlist?list=PLsHuNzTdkE5Cn4PyS7HdV0Vg8JsfdgQlA&si=0WynLcOwNeEISQCY
- Mark as New
- Bookmark
- Subscribe
- Mute
- Subscribe to RSS Feed
- Permalink
- Report Inappropriate Content
03-07-2025 03:21 PM
Hello @David Fiedler
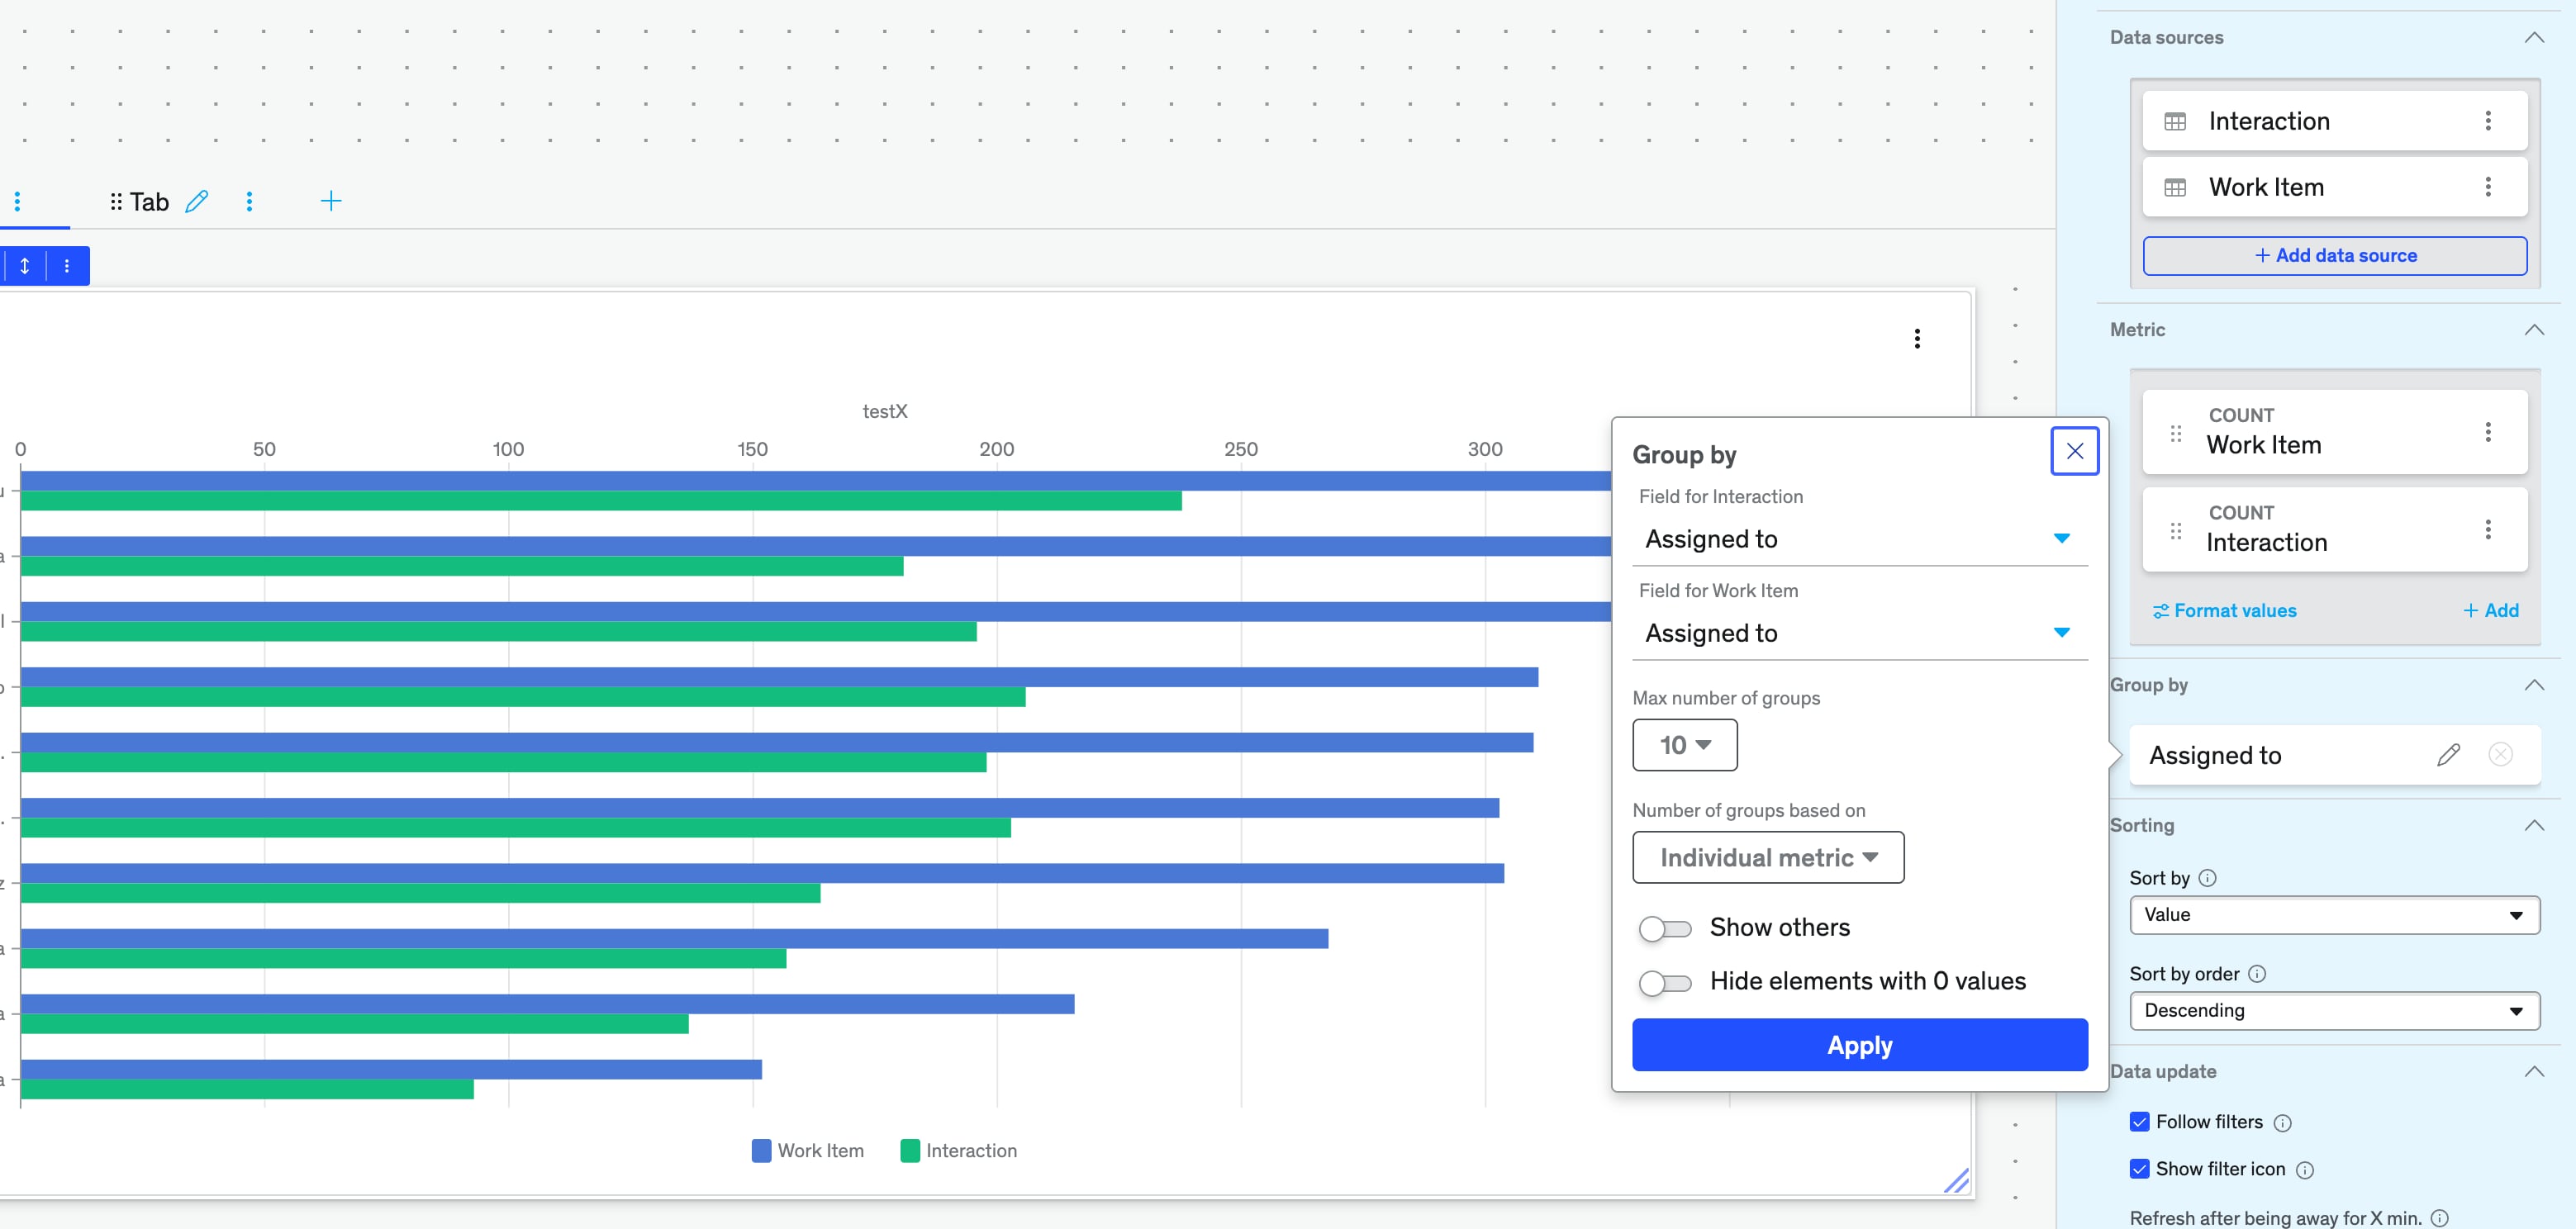
Platform Analytics doesn't directly allow to group by and stack , instead you can use multi source visualization or data foundation.
1)Go to Platform Analytics and create a New Multi-Source Visualization.
2)Select your first data source (Interactions).
3)Select your second data source (Work Items).
Ensure both data sources are grouped by "Assigned To".
Instead of stacking the second group in the same bar, use a multi-source breakdown, which will allow you to see both Interactions (stacked by Contact Type) and Work Items in the same visualization.
- Mark as New
- Bookmark
- Subscribe
- Mute
- Subscribe to RSS Feed
- Permalink
- Report Inappropriate Content
02-13-2026 01:07 AM
Hello Shivalika,
I have a similar use case.
Can you please detail what do you mean by "use a multi-source breakdown" and the steps to set it up in the above example?
Regards
Flavio
- Mark as New
- Bookmark
- Subscribe
- Mute
- Subscribe to RSS Feed
- Permalink
- Report Inappropriate Content
03-09-2025 06:15 AM
Hello Shivalika,
Thank you for your response. I need to configure this on a horizontal bar. I was hoping there's an easy way to accomplish this directly within the Platform Analytics dashboard using the in-line editor, similar to what's possible in legacy reports. However, it seems this isn't an available option without creating breakdowns, sources, etc. If I'm missing something, please let me know, as I haven't found a way to perform this action in the in-line editor so far.
- Mark as New
- Bookmark
- Subscribe
- Mute
- Subscribe to RSS Feed
- Permalink
- Report Inappropriate Content
03-09-2025 06:20 AM
Hello @David Fiedler
Unfortunately that's the limitation of standard reporting. So you will need to go by the multi source breakdown as described by me in the above answer.
Please mark my answer as helpful and accept solution if it helped you in anyway.
Regards,
Shivalika
My LinkedIn - https://www.linkedin.com/in/shivalika-gupta-540346194
My youtube - https://youtube.com/playlist?list=PLsHuNzTdkE5Cn4PyS7HdV0Vg8JsfdgQlA&si=0WynLcOwNeEISQCY