Time Card Weekly Report
- Mark as New
- Bookmark
- Subscribe
- Mute
- Subscribe to RSS Feed
- Permalink
- Report Inappropriate Content
05-09-2017 06:50 PM
Hello all,
First time posting hope someone can give me some guidance here. Currently I have been tasked with creating a weekly/daily dashboard report on hours recorded on time cards for a certain assignment group.
Would need it be visualized as a scorecard and breakdown would be by user and it would sum up all the hours user inputted (all timecards) per day for that current week. Example below
| User | Monday | Tuesday | Wednesday | Thursday | Friday | Saturday | Sunday |
|---|---|---|---|---|---|---|---|
| User A | 7 Hours | 4 | 7 | 4 | 1 | 0 | 0 |
| User B | 4 Hours | 2 | 1 | 3 | 1 | 1 | 0 |
| User C | 2 Hours | 0 | 3 | 2 | 1 | 0 | 0 |
Currently stumped and haven't been able to find a way to get this done. Any help will be appreciated.
Thanks,
- Labels:
-
Dashboard
-
Performance Analytics
-
Reporting
- Mark as New
- Bookmark
- Subscribe
- Mute
- Subscribe to RSS Feed
- Permalink
- Report Inappropriate Content
05-09-2017 07:06 PM
Hi George,
Have you tried making a pivot report?
This is what I usually use.
- Mark as New
- Bookmark
- Subscribe
- Mute
- Subscribe to RSS Feed
- Permalink
- Report Inappropriate Content
05-10-2017 02:32 PM
Hi Darla,
I tried that and I get something like the picture below which doesn't give me what I need.

I also tried to do a list which almost gives me what I need but doesn't sum up the totals for each day and per grouping you would have to expand each user to see the times inputted which management does not want.

I also tried with performance analytics and got it to look like what I needed but the data was inaccurate. If users added time from previous days they had missed it would add everything into today's score. This is per indicator source being set updated on today as filter condition. Couldn't think of any other condition to use for this. Example below on how it looked like.

This is as far as I have gotten and still stumped.
- Mark as New
- Bookmark
- Subscribe
- Mute
- Subscribe to RSS Feed
- Permalink
- Report Inappropriate Content
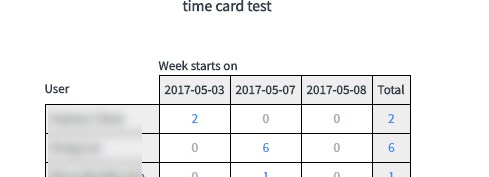
06-19-2017 10:56 AM
Hi George,
Is this what you're looking for:
This is built using Explore Analytics; so it's live data, if a user is logged in they'd be able to drill down on the data, and it can be embedded in ServiceNow dashboards.
