

servicenowkevin

ServiceNow Employee
Options
- Subscribe to RSS Feed
- Mark as New
- Mark as Read
- Bookmark
- Subscribe
- Printer Friendly Page
- Report Inappropriate Content
02-13-2015
11:15 AM
I know I've posted a lot about report creation and importance and talked a bit about reports I use, but it's a topic that always comes up and people always seem interested in it. So, I'm putting together another blog about it again today. Korbey Sellen mentioned in a comment earlier in the week that they'd be interested in knowing about the reports I run.
First, most of the reporting I do is in the Reports section, but I will make use of Performance Analytics for a few things.
Public KB Views by Browser
We had a desire to see which browsers were being used to access our content. With some customization, we were able to start collecting that data and Erich Zirnhelt put together this report so that we can start to track the browsers used to search our Knowledge Base articles.

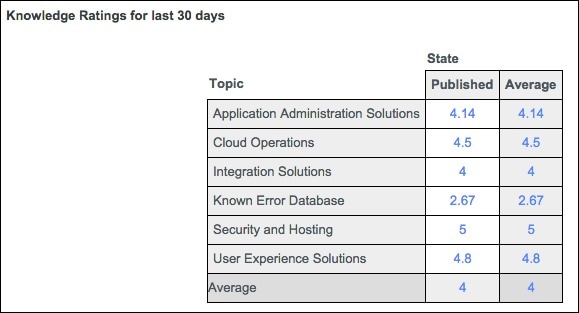
Knowledge Article Ratings
This report gives me the average rating across article topics over the past 30 days. I use it to track our KB quality. I want to always be above a 4 star average. If I see an area trending lower, I have a look at the articles with lower ratings and make a judgement call on what to do. Sometimes it's just a bad news article other times it's an article that actually needs updating.

Tracking View Growth by Topic
If we're getting more viewership, where are those viewing coming? Are the views coming from somewhere we expected growth because me made a big push there and other areas that we thought would reduce? This report allows me to answer those questions and focus in on areas where I'm expecting more viewership.
Views aren't the whole story here though. For this report, I need to look at incident volume as well. If I'm seeing higher incident volume in one area, I want to make sure we have content there and have the content viewed/used. I expect correlation between viewership and incident volume, either slowing the rate of volume increase or even reducing the volume.
Got a question about these reports or any other I might be using? Is there a report you'd like to build, but you're not sure if it's possible? I might be able to answer that too... no promises though. I sometimes enlist people to help me with these. Let me know in the comments.
3 Comments
You must be a registered user to add a comment. If you've already registered, sign in. Otherwise, register and sign in.
